Yesterday the top 25 vBlogs were announced and once again I’m in the top 5. I would like to thank all who have voted for me! It’s great to see that the content is appreciated.
The broadcast:
Looking forward, there is a lot of content getting ready to be published and I hope to release my 5th book this year, the vSphere 6.x host resource deep dive. I’m excited about the content I’m working on and I’ll hope you guys will too!
Thanks!
Frank
Insights into VM density
For the last 3 months my main focus within PernixData has been (and still is) the PernixCloud program. In short PernixData Cloud is the next logical progression of PernixData Architect and provides visibility into and analytics of virtual datacenters, it’s infrastructure, and it’s applications. By providing facts on the various elements of the virtual infrastructure, architects and administrators can design their environment in a data-driven way.
The previous article “Insights into CPU and Memory configurations of ESXi hosts” zoomed in to the compute configuration of 8000 ESXi hosts and helped us understand which is the most popular system in today’s datacenter running VMware vSphere. The obvious next step was to determine the average number of virtual machines on these systems. Since that time the dataset has expanded and it now contains data of more than 25.000 ESXi hosts.
An incredible dataset to explore I can tell you and it’s growing each day. Learning how to deal with these vast quantities of data is incredibly interesting. Extracting various metrics from a dataset this big is challenging. Most commercial tools are not designed to cope with this amount of data, thus you have to custom build everything. And with the dataset growing at a rapid pace, you are constantly exploring the boundaries of what’s possible with software and hardware.
VM Density
After learning what system configurations are popular, you immediately wonder how many virtual machines are running on that system. But what level of detail do you want to know? Will this info be useable for architects and administrators to compare their systems and practical to help them design their new datacenter?
One of the most sought after question is the virtual CPU to physical CPU ratio. A very interesting one, but unfortunately to get a result that is actually meaningful you have to take multiple metrics into account. Sure you can map out the vCPU to pCPU ratio, but how do you deal with the fact of oversizing of virtual machines that has been happing since the birth of virtualization? What about all these countless discussions whether the system only needs a single or double CPU because it’s running a single threaded program? How many times have you heard the remark that the vendor explicitly states that the software requires at least 8 CPU’s? Therefor you need to add utilization of CPU to get an accurate view, which in turn leads to the question what timeframe you need to use to understand whether the VM is accurately sized or whether the vCPUs are just idling most of the time? You are now mixing static data (inventory) and transient data (utilization). Same story applies for memory.
In consequence I focused just on the density of virtual machines per host. The whole premise of virtualization is to exploit the variation of activity of applications, combined with distribution mechanisms as DRS and VMturbo you can argue that virtual and physical compute configurations will be matched properly. Therefor it’s interesting to see how far datacenters stretch their systems and understand the consolidation ratio of virtual machines. Can we determine a sweet spot of the number of virtual machines per host?
The numbers
Discovered earlier, dual socket systems are the most popular system configuration in the virtual datacenters, therefor I focused on these systems only. With the dataset now containing more than 25.000 ESXi hosts, it’s interesting to see what the popular CPU types are.
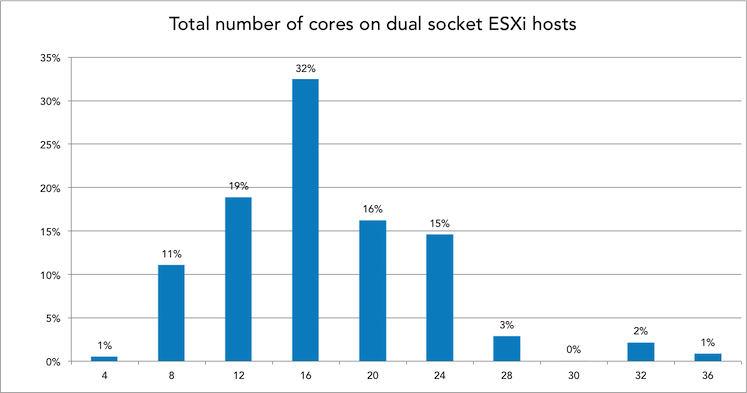
The popular systems contained in total 12, 16, 20 and 24 cores. Therefor the popular CPU’s of today are 6, 8, 10 and 12 cores. But since we typically see a host as a “closed” system and trust on the host local CPU scheduler to distribute the vCPUs amongst the available pCPUs, all charts use the total cores per system instead of on a per-CPU basis. For example a 16 cores system is ESXi host containing two 8 cores CPUs.
Before selecting a subset of CPU configurations let’s determine the overall distribution of VM density.
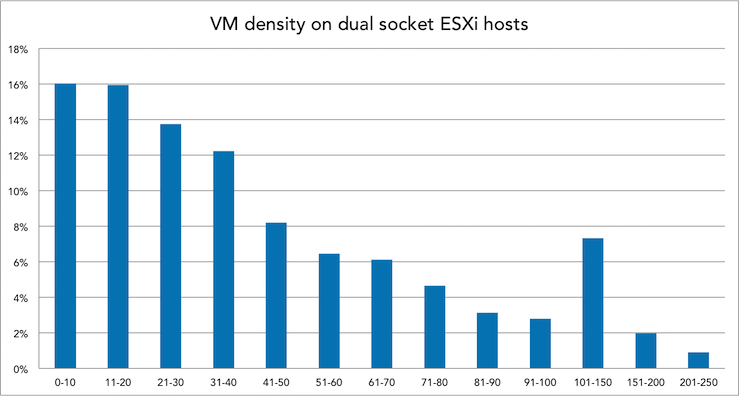
Interesting to see that it’s all across the board, VM density ranging from 0-10 VM’s per host up to more than 250. There were some outliers, but I haven’t included them. One system runs over 580 VM’s, this system contains 16 cores and 192 GB. Let’s dissect the VM density per CPU config.
Dissecting it per CPU configuration
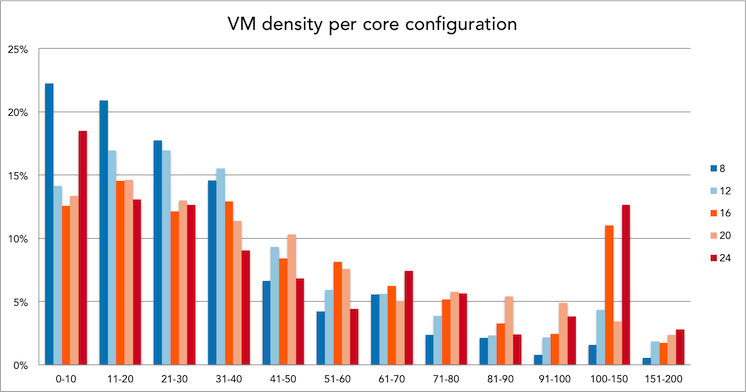
Instead of focusing on all dual socket CPU configurations, I narrowed it down to three popular configurations. The 16 core config as it’s the most popular today, and the 20 to 24 core as I expect this to be the configuration as the default choice for new systems this year. This allows us to compare the current systems in today’s datacenter to the average number and help you to understand what VM density possible future systems run.
Memory
Since host memory is an integral part of providing performance to virtual machines, it’s only logical to determine VM density based on CPU and Memory configurations. What is the distribution of memory configuration of dual socket systems in today’s virtual datacenters?
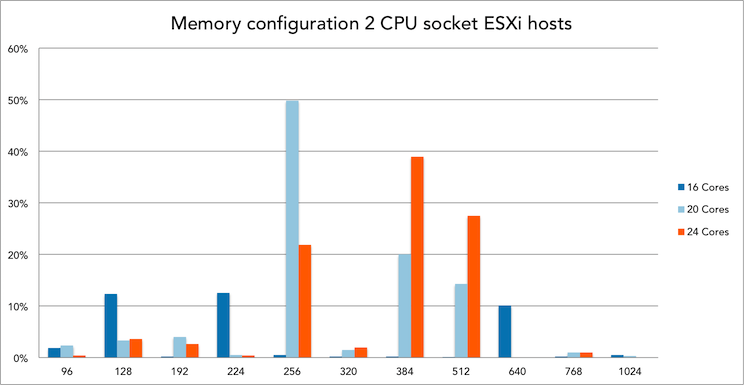
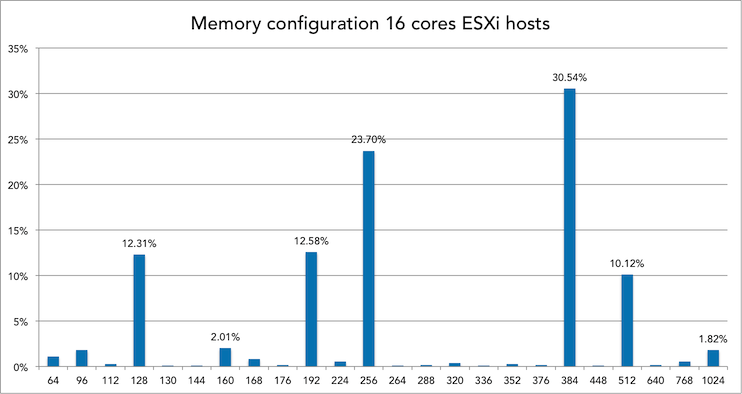
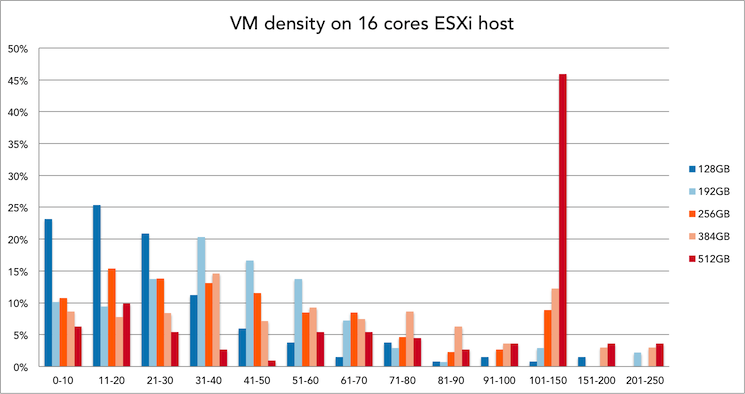
Memory config and VM density of 16 cores systems
30% of all 16 cores ESXi hosts is equipped with 384GB of memory. Within this configuration, 21 to 30 VMs is the most popular VM density.
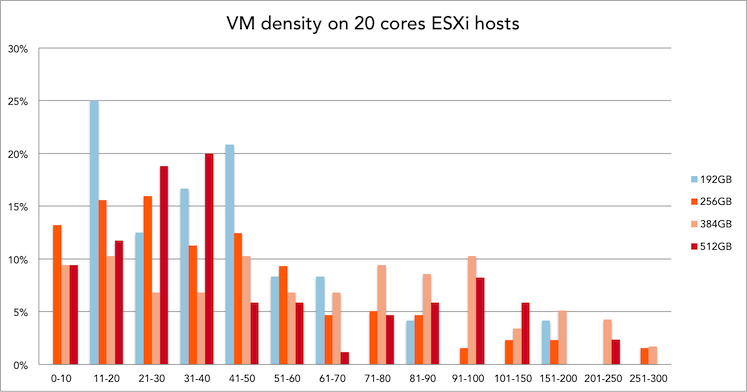
Memory config and VM density of 20 cores systems
50% of all 20 cores ESXi hosts is equipped with 256GB of memory. Within this configuration, 31 to 40 VMs is the most popular VM density.
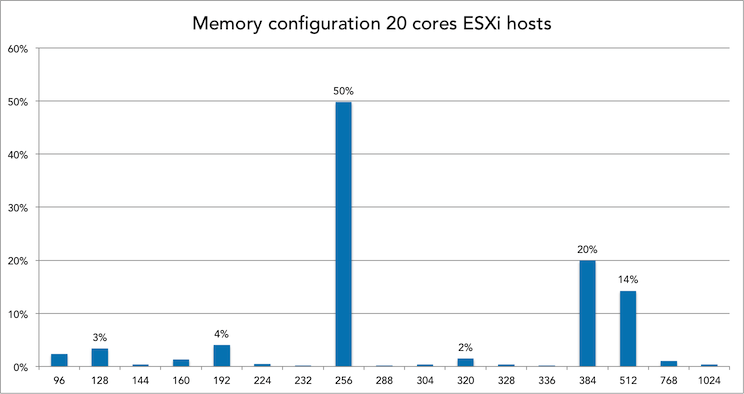
Interesting to see that these systems, on average, have to cope with less memory per core than the 16 cores system (24GB per core versus 12,8GB per core)
Memory config and VM density of 24 cores systems
39% of all 24 cores ESXi hosts is equipped with 384GB of memory. Within this configuration, 101 to 150 VMs is the most popular VM density.
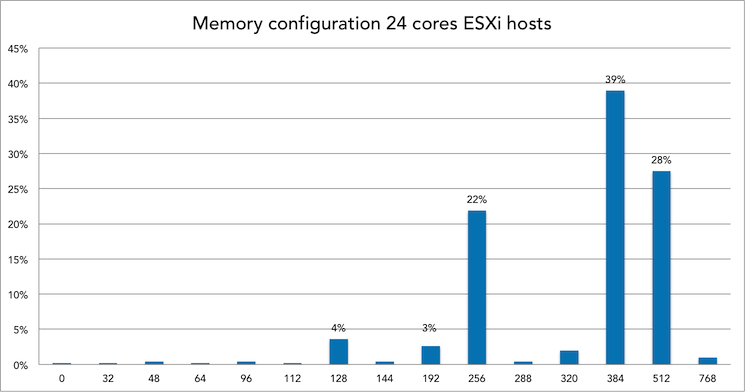
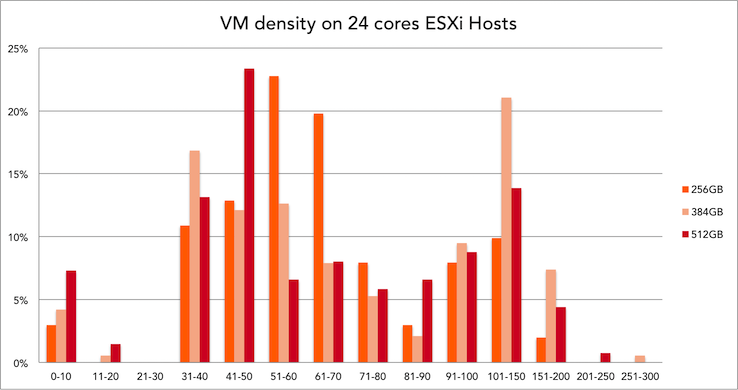
101 to 150 VM’s sound like a VDI platform usage. Are these systems the sweetspot for virtual desktop environments?
Conclusion
Not only do we have an actual data on VM density now, other interesting facts were discovered as well. When I was crunching these numbers one thing that stood out to me was memory configurations used. Most architects I speak with tend to configure the hosts with as much memory as possible and swap out the systems when their financial lifespan has ended. However I seen some interesting facts, for example memory configurations such as 104 GB or 136 GB per system. How do you even get 104GB of memory in such a system, did someone actually found a 4GB DIMM laying around and decided to stick it in th system? More memory = better performance right? Please ready my memory deepdive series on how this hurts your overall performance. But I digress. Another interesting fact is that 4% of all 24 cores systems in our database are equipped with 128GB of memory. That is an average of 5,3 GB per core, 64GB per NUMA node. Which immediately raises questions such as average host memory per VM or VM density per NUMA node. The more we look at data, the more questions arise. Please let me know what questions you have!
Insights into CPU and Memory configuration of ESXi Hosts
Recently Satyam Vaghani wrote about PernixData cloud. In short PernixData Cloud is the next logical progression of PernixData Architect and provide visibility and analytics around virtual datacenters, it’s infrastructure and applications.
As a former architect I love it. The most common question asked by customers around the world was how other companies are running and designing their virtual datacenters. Which systems do they use and how do these system perform with similar workload? Many architects struggle with justifying their bill of materials list when designing their virtual infrastructure. Or even worse getting the budget. Who hasn’t heard the reply when suggesting their hardware configuration: “you want to build a Ferrari, a Mercedes is good enough”. With PernixData Cloud you will be able to show trends in the datacenter, popularity of particular hardware and application details. It let you start ahead of the curve, aligned with the current datacenter trends instead of trailing. Of course I can’t go into detail as we are still developing the solution, but I can occasionally provide a glimpse of what we are seeing so far.
For the last couple of days I’ve been using a part of the dataset and queried 8000 hosts on their CPU, memory and ESXi build configuration to get insight in popularity of particular host configurations.
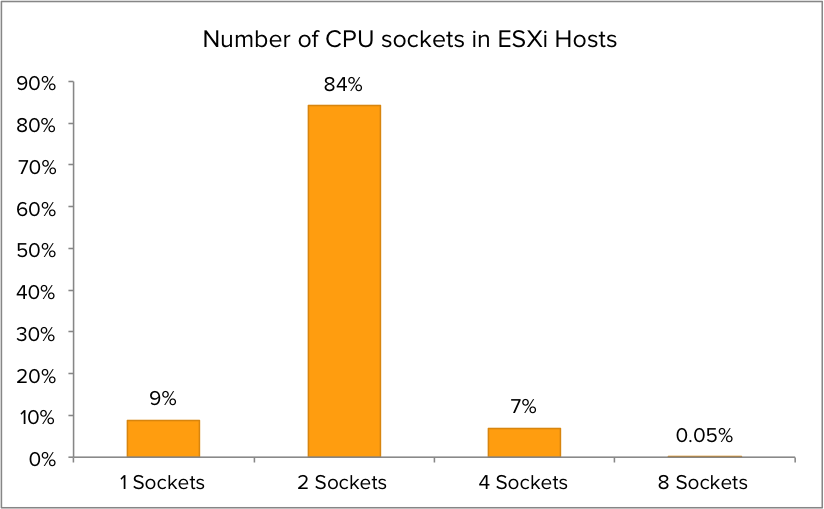
CPU socket configuration
I was curious about the distribution of CPU socket configurations. After analyzing the dataset it is clear that dual socket CPU configurations are the most popular setup. Although single CPU socket configuration are more common than quad CPU socket in the dataset, quad core are more geared towards running real world workload while single CPU configurations are typically test/dev/lab servers. Therefor the focus will primarily on dual CPU socket systems and partially quad CPU sockets systems. The outlier of this dataset is the 8 socket servers. Interesting enough some of these are chuck-full with options. Some of them were equipped with 15 core CPU’s. 120 CPU cores per host, talk about CPU power!
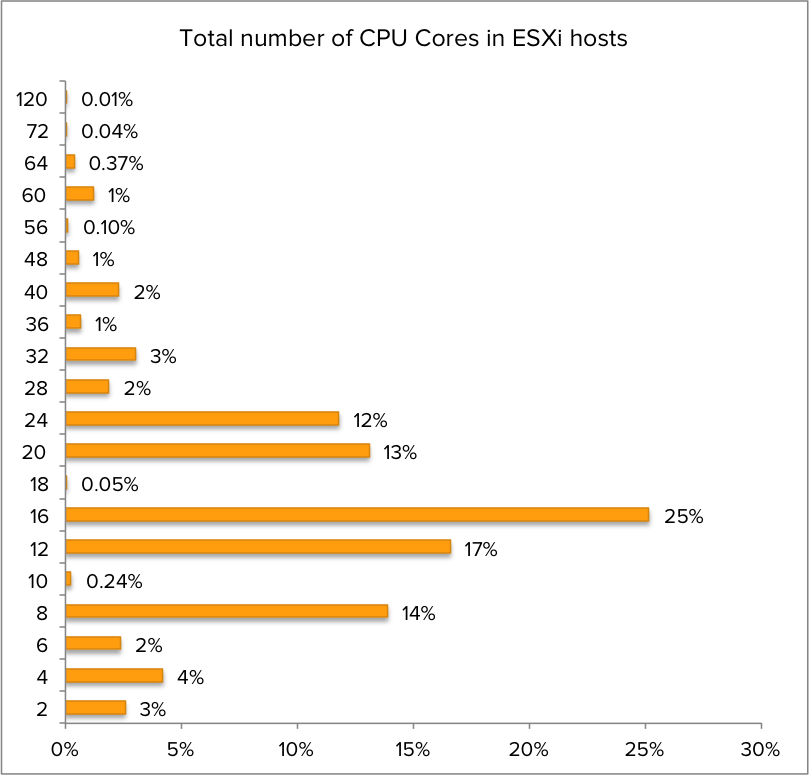
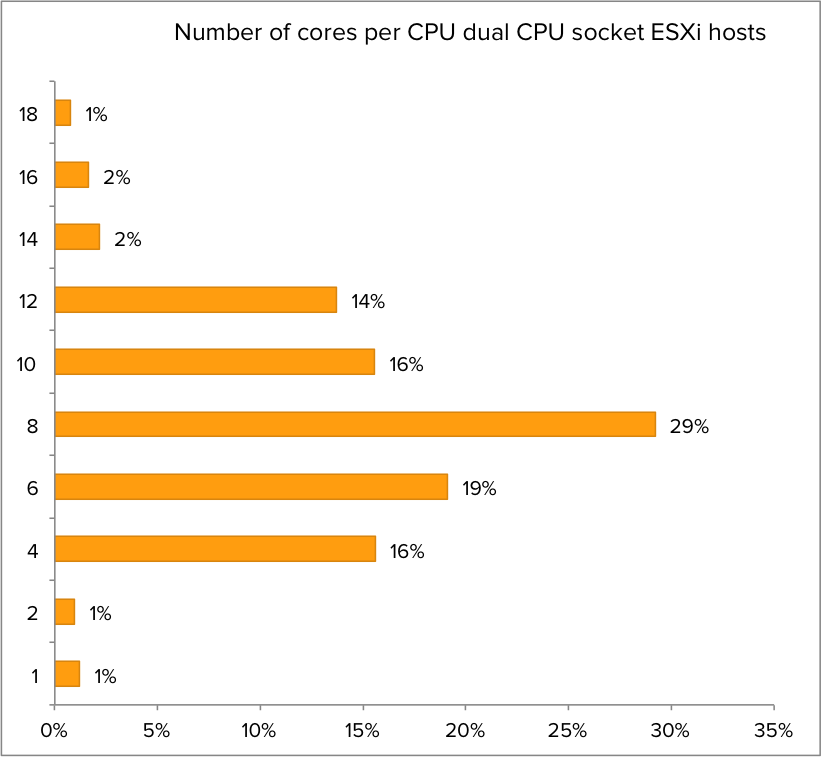
CPU core distribution
What about the CPU core popularity? The most popular configuration is 16 cores per ESXi host, but without the context of CPU sockets one can only guess which CPU configuration is the most popular.
Core distribution of dual CPU socket ESXi hosts
When zooming in to the dataset of dual CPU socket ESXi host, it becomes clear that 8 Core CPU’s are the most popular. I compared it with an earlier dataset and quad and six core systems are slowly reducing popularity. Six core CPU’s were introduced in 2010, assumable most will be up for a refresh in 2016. I intend to track the CPU configurations to provide trend analysis on popular CPU configurations in 2016.
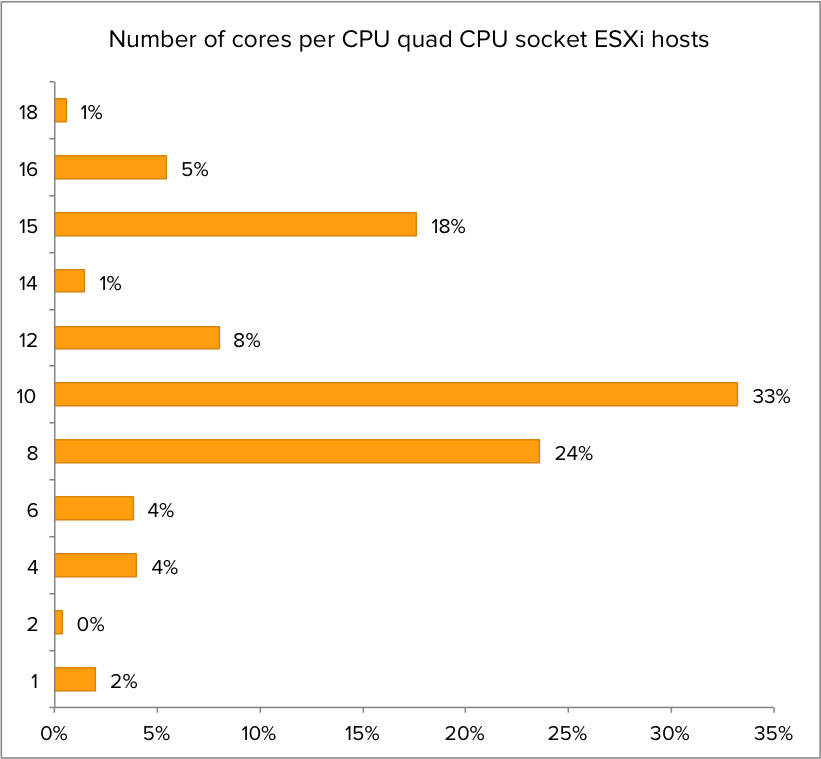
Core count quad socket CPU systems
What about quad socket CPU systems? Which CPU configuration is the most populair? It turns out that CPU’s containing 10 cores are the sweetspot when it comes to configuring a Quad core CPU system.
Memory configuration
Getting insights into memory configuration of the servers provides us a clear picture of the compute power of these systems. What is the most popular memory configuration of dual socket server? As it turns out 256 and 384 GB are the most memory popular configuration. Today’s servers are getting beefy!
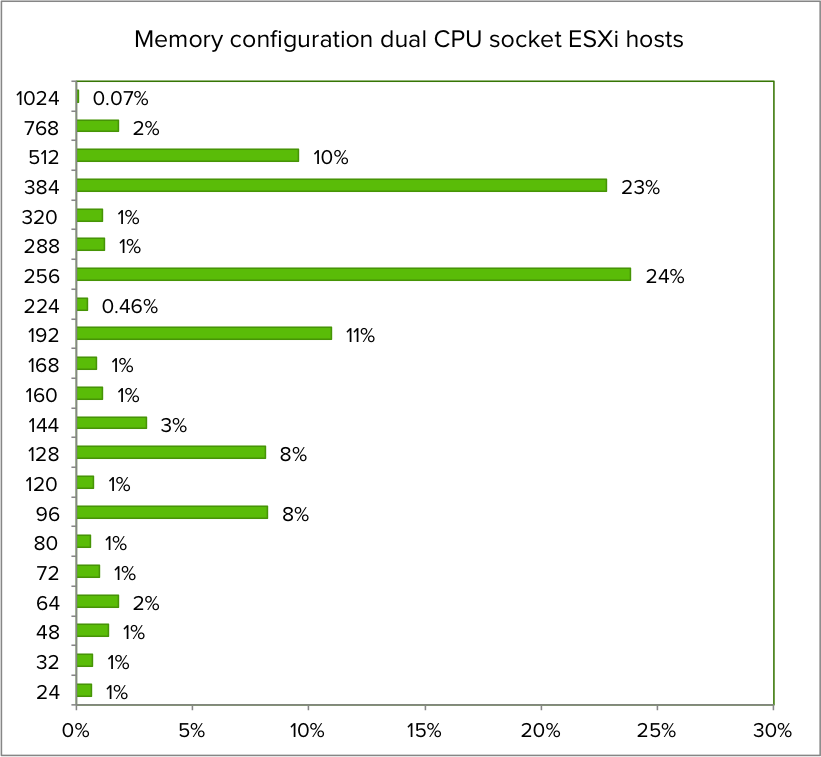
Zooming into the dataset quering the memory configuration of dual socket 8 core servers, the memory configuration distribution is as follows:

What about the memory configuration of quad CPU servers?
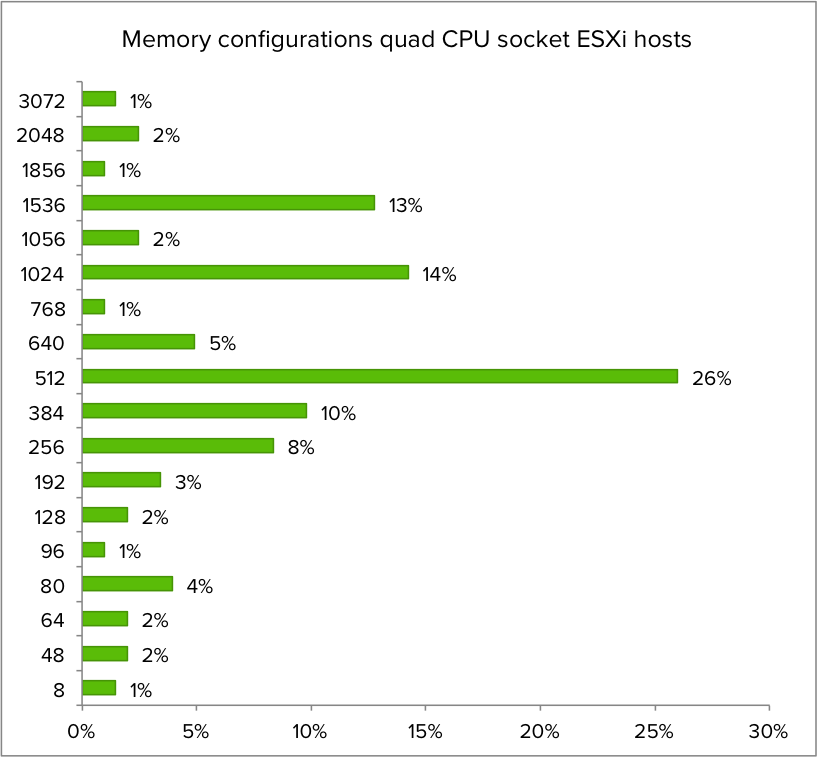
NUMA
512 GB is the most popular memory configuration for quad CPU socket ESXi host. Assuming the servers are configured properly, this configuration is providing the same amount of memory to each NUMA node of the systems. The most popular NUMA node is configured with 128 GB in both dual and quad CPU socket systems.
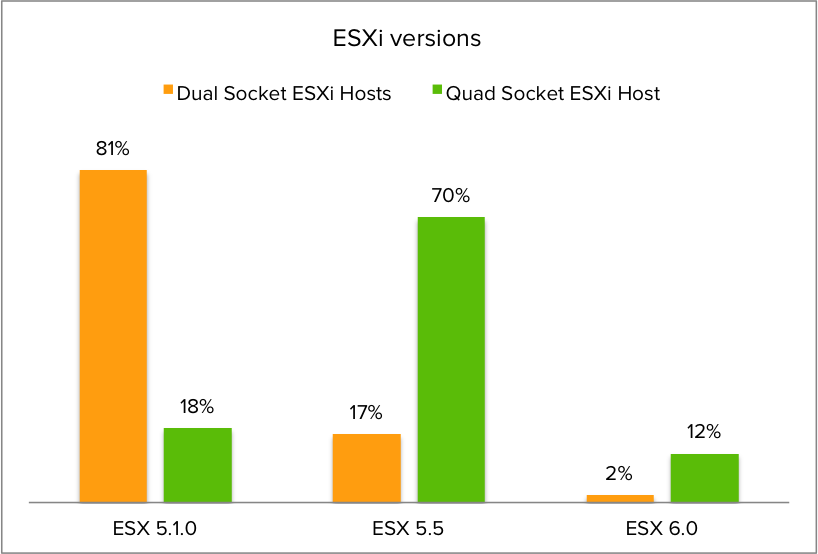
ESXi version distribution
I was also curious about the distribution of ESXi versions amongst the dual and quad CPU socket systems. It turns out that 5.1.0 is the most popular ESXi version for dual CPU systems, while most Quad CPU socket machines have ESXi version 5.5 installed
More To Come
Satyam and I hope to publish more results from our dataset in the coming months. The dataset is expanding rapidly, increasing the insights of the datacenters around the globe. And we hope to cover other dimensions like applications and the virtualization layer itself. Please feel free to send me interesting questions you might have for the planet’s datacenters and we’ll see what we can do. Follow me on twitter @frankdenneman
Hammer, MagicBands and challenging status quo
One of my favorite business books is the famous book of Michael Hammer “Reengineering the Corporation”. The theme is the book is to take a hard look at business processes and radically change these old and existing processes.
Hammer states that typically companies sped up their processes by implementing a newer iteration of existing technology. Many processes are dated before the advent of the computers and just by automating the process it can only optimizes performance marginally. Embedding computers in the archaic processes cannot address their fundamental performance challenges.
By understanding what the process is trying to achieve one can break away from the existing design principles of the process. One great example is one of my favorite technologies is the Disney’s MagicBand and the way it’s used to radically change processes.
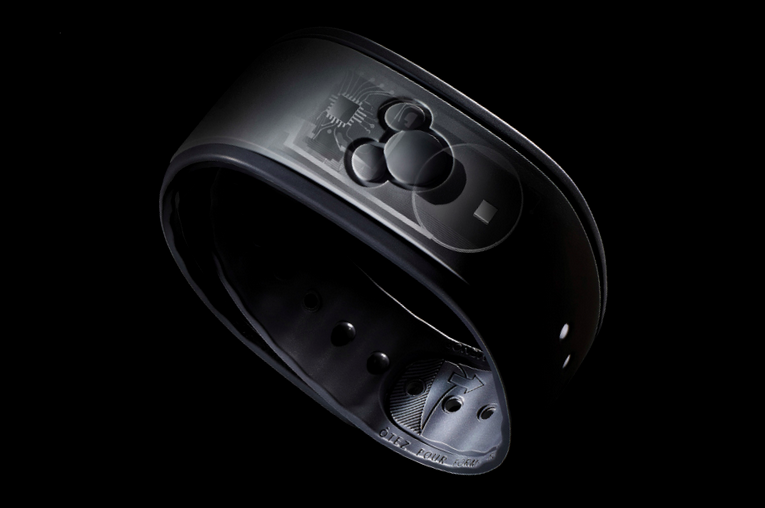
Disney’s MagicBand
The MagicBand is what is commonly referred to as a wearable. Inside the bracelet are a RFID chip and a radio. The parks have long range and short-range scanners along with sensors to interact with the MagicBand bracelet. One of the perks of my job is to speak to people who deliver cutting edge technology and as you can imagine I was very thrilled to speak to some of the team members who worked on the MagicBand platform.
In essence the Disney MagicBand replaces every transaction between the customer and cast members or Disney parks and resorts. The MagicBand becomes your key to anything. It allows access to the park, access to the resorts and automatic payment. Its goal is to create a frictionless experience for the customer, increasing the satisfaction, which of course will increase spending.
Instead of tinkering with existing processes Disney overhauled a lot of processes and many more are to follow. A great example is the overhaul of the check-in process and how it’s completely inline with the Hammer doctrine. Instead of buying newer faster desktop computers to speed up the check-in process, customers can go directly to their hotel room, bypassing the check in process all together. Disney’s sends the MagicBand to your home and prior to your visit the resort informs you via email which room is yours for your stay. Just walk up to your room and unlock the door by taping your MagicBand against the sensor on the door.
MagicBands allows Disney to get rid of the ancient turnstiles that is the first port of anxiety of new parents and their strollers, instead of being funnelled into narrow cramped isles the entrance is now in the shape of a inviting V shape form with incredible process speeds. Just hold your MagicBand to the access point and wait to be greeted by an welcoming green glow, from then on its off to your favorite experience.

The MagicBand platform allows for new experiences as well. What about having a more personalized interaction with cast members? What if Cinderella greets your daughter by name and tells her that she knows she is her favorite princess or that she wishes her a happy birthday? Just mind-blowing and an experience she will never forget.
Range scanners, sensors, WIFI, smart phones apps, user profiles and an insane amount of data crunching make this happen. Customers use the smart phone app to access their schedules and their user profiles. Countless short and long-range sensors scattered across the park pick up the signals of the bracelets. These systems are connected to each other, they collect data, and they use the captured data to optimize the experience of the customers. Data on visitors traffic flow, food orders and waiting times can be used to realign internal resources. Ever heard about Internet of things? This is the poster child of Internet of things.
Stop! Hammer Time
Circling back to the opening statement, using newer iteration of existing technology only provide marginally performance increases. Advances like the MagicBand require new technologies and new ways to operationalize these technologies in datacenters. Not every company is of the same size as Disney, but one thing is certain, most companies face the same challenge Disney has. How to reduce cost, increase efficiency and provide a new experience that makes them unique in a highly competitive market?
A lot of brilliant people are trying to solve these problems by creating technical solutions and it’s up to the IT team to understand if these suit their operation models. How can you reengineer your corporation and create a new service offering while your IT is stuck in the past? Stuck using systems that are designed to work in infrastructures dating back to the early ‘70’s? Where they just found out that the market was bigger than 5 computers? Everything has to align, when the business changes it models, the IT team should not take anything for granted, they too need to aim for quantum leaps of performance.
Markets shift rapidly; IT needs to be able to respond almost in a way that anticipates their needs. Maybe even in a way that it doesn’t feel remarkable at all, high service standards are the norm! Within the realm of virtualized datacenters two technology advancements can create an experience that might provide a ubiquitous experience to the business but provide the magic to the IT team; Scale out storage and object based storage.
Scale out storage and object based storage
Proper Scale out storage systems allows you to operationalize new advancement in storage technology as soon as they are available. They allow virtual datacenters to cater to any performance requirement possible any time. While, and this is very important, without impact current workloads that are using the same platform. Many application vendors move away from a monolithic application architecture, why keep holding on to the relics of the past by using a monolithic storage architecture for performance requirements?
Object based storage, such as VMware VVOLs, allows you to fundamentally change how to provide data services to systems (virtual machines). Instead of creating management constructs and aligning data services to these logical layers (LUNs and datastores), data services can be directly applied to the specific machine. Virtual machines become first class citizens on storage systems, allowing IT teams to cater to requirements that both affect the business as well as the IT team requirements.
Challenge status quo
Hammer stated don’t ask, “How can we do what we do faster?” But ask; Why do we do it the way we do?” In essence, challenge status quo if you want to keep on moving forward in a time that introduces new technologies and application landscapes on a daily basis!
DB Deepdive part 6: Query Plans, Intermediate Results, tempdb and Storage Performance
Welcome to part 6 of the Database workload characteristics series. Databases are considered to be one of the biggest I/O consumers in the virtual infrastructure. Database operations and database design are a study upon themselves, but I thought it might be interested to take a small peak underneath the surface of database design land. I turned to our resident Database expert Bala Narasimhan, PernixData’s VP of products to provide some insights about the database designs and their I/O preferences.
Previous instalments of the series:
Part 1 – Database Structures
Part 2 – Data pipelines
Part 3 – Ancillary structures for tuning databases
Part 4 – NoSQL platforms
Part 5 – Query Execution Plans
In a previous article I introduced the database query optimizer and described how it works. I then used a TPC-H like query and the SQL Server database to explain how to understand the storage requirements of a query via the query optimizer.
In today’s article we will deep dive into a specific aspect of query execution that severely impacts storage performance; namely intermediate results processing. For today’s discussion I will use the query optimizer within the PostgreSQL database. The reason I do this is because I want to show you that these problems are not database specific. Instead, they are storage performance problems that all databases run into. In the process I hope to make the point that these storage performance problems are best solved at the infrastructure level as opposed to doing proprietary infrastructure tweaks or rewrites within the database.
After a tour of the PostgreSQL optimizer we will go back to SQL Server and talk about a persistent problem regarding intermediate results processing in SQL Server; namely tempdb. We’ll discuss how users have tried to overcome tempdb performance problems to date and introduce a better way.
What are intermediate results?
Databases perform many different operations such as sorts, aggregations and joins. To the extent possible a database will perform these operations in RAM. Many times the data sets are large enough and the amount of RAM available is limited enough that these operations won’t fully fit in RAM. When this happens these operations will be forced to spill to disk. The data sets that are written to and subsequently read from disk as part of executing operations such as sorts, joins and aggregations are called intermediate results.
In today’s article we will use sorting as an example to drive home the point that storage performance is a key requirement for managing intermediate results processing.
The use case
For today’s example we will use a table called BANK that has two columns ACCTNUM and BALANCE. This table tracks the account numbers in a bank and the balance within each account. The table is created as shown below:
Create Table BANK (AcctNum int, Balance int);
The query we are going to analyze is one that computes the number of accounts that have a given balance and then provides this information in ascending order by balance. This query is written in SQL as follows:
Select count(AcctNum), Balance from BANK GROUP BY Balance ORDER BY Balance;
The ORDER BY clause is what will force a sort operation in this query. Specifically we will be sorting on the Balance column. I used the PostgreSQL database to run this query.
I loaded approximately 230 million rows into the BANK table. I made sure that the cardinality of the Balance column is very high. Below I have a screenshot from the PostgreSQL optimizer for this query. Note that the query will do a disk based merge sort and will consume approximately 4 GB of disk space to do this sort. A good chunk of the query execution time was spent in the sort operation.

A disk-based sort, and other database operations that generate intermediate results, is characterized by large writes of intermediate results followed by reads of those results for further processing. IOPS is therefore a key requirement.
What is especially excruciating about the sort operation is that it is a materialization point. What this means is that the query cannot make progress until the sort is finished. You’ve essentially bottlenecked the entire query on the sort and the intermediate results it is processing. There is no better validation of the fact that storage performance is a huge impediment for good query times.
What is tempdb?
tempdb is a system database within SQL Server that is used for a number of reasons including the processing of intermediate results. This means that if we run the query above against SQL Server the sorting operation will spill intermediate results into tempdb as part of processing.
It is no surprise then that tempdb performance is a serious consideration in SQL Server environments. You can read more about tempdb here.
How do users manage storage performance for intermediate results including tempdb?
Over the last couple of years I’ve talked to a number of SQL Server users about tempdb performance. This is a sore point as far as SQL Server performance goes. One thing I’ve seen customers do to remediate the tempdb performance problem is to host tempdb alone in arrays that have fast media, such as flash, in them in the form of either hybrid arrays or All Flash Arrays (AFA). The thought process is that while the ‘fast array’ is too expensive to standardize on, it makes sense to carve out tempdb alone from it. In this manner, customers look at the ‘fast array’ as a performance band aid for tempdb issues.
On the surface this makes sense since an AFA or a hybrid array can provide a performance boost for tempdb. Yet it comes with several challenges. Here are a few:
- You now have to manage tempdb separately from all the other datastores for your SQL Server.
- You procure the array for tempdb yet you do not leverage any of its data services. You use it as a performance band aid alone. This makes the purchase a lot more expensive than it seems on paper.
- For queries that don’t leverage tempdb the array is not useful.
- Performance problems in databases are not limited to tempdb. For example, you may be doing full table scans and these don’t benefit from the array.
- You cannot leverage innovations in media. You cannot, for example, leverage RAM or PCM or anything else that will come in the future for tempdb.
How can PernixData FVP help?
In my mind PernixData FVP is the ideal solution for storage performance problems related to intermediate results in general and tempdb in particular. Intermediate result processing, including tempdb, shows very good temporal locality and is therefore an ideal candidate for FVP. Below are some other reasons why FVP is ideal for this scenario:
- PernixData FVP allows you to use all server side media, flash or RAM, for accelerating tempdb and intermediate results processing.
- You don’t need to configure anything separately for this. Instead you operate at the VM level and accelerate your database VM as a result of which every I/O operation is enhanced including intermediate results processing.
- As your tempdb requirements change – lets say you need for space for handling it – it’s simply a matter of replacing one flash card with bigger one as far as FVP is concerned. There is no down time and the application is not impacted. This allows you to ride the price/performance curve of flash seamlessly.