Welcome to part 5 of the Database workload characteristics series. Databases are considered to be one of the biggest I/O consumers in the virtual infrastructure. Database operations and database design are a study upon themselves, but I thought it might be interested to take a small peak underneath the surface of database design land. I turned to our resident Database expert Bala Narasimhan, PernixData’s VP of products to provide some insights about the database designs and their I/O preferences.
Previous instalments of the series:
Part 1 – Database Structures
Part 2 – Data pipelines
Part 3 – Ancillary structures for tuning databases
Part 4 – NoSQL platforms
Databases are a critical application for the enterprise and usually have demanding storage performance requirements. In this blog post I will describe how to understand the storage performance requirements of a database at the query level using database tools. I’ll then explain why PernixData FVP helps not only to solve the database storage performance problem but also the database manageability problem that manifests itself when storage performance becomes a bottleneck. Throughout the discussion I will use SQL Server as an example database although the principles apply across the board.
Query Execution Plans
When writing code in a language such as C++ one describes the algorithm one wants to execute. For example, implementing a sorting algorithm in C++ means describing the control flow involved in that particular implementation of sorting. This will be different in a bubble sort implementation versus a merge sort implementation and the onus is on the programmer to implement the control flow for each sort algorithm correctly.
In contrast, SQL is a declarative language. SQL statements simply describe what the end user wants to do. The control flow is something the database decides. For example, when joining two tables the database decides whether to execute a hash join, a merge join or a nested loop join. The user doesn’t decide this. The user simply executes a SQL statement that performs a join of two tables without any mention of the actual join algorithm to use.
The component within the database that comes up with the plan on how to execute the SQL statement is usually called the query optimizer. The query optimizer searches the entire space of possible execution plans for a given SQL statement and tries to pick the optimal one. As you can imagine this problem of picking the most optimal plan out of all possible plans can be computationally intensive.
SQL’s declarative nature can be sub-optimal for query performance because the query optimizer might not always pick the best possible query plan. This is usually because it doesn’t have full information regarding a number of critical components such as the kind of infrastructure in place, the load on the system when the SQL statement is run or the properties of the data. . One example of where this can manifest is called Join Ordering. Suppose you run a SQL query that joins three tables T1, T2, and T3. What order will you join these tables in? Will you join T1 and T2 first or will you join T1 and T3 first? Maybe you should join T2 and T3 first instead. Picking the wrong order can be hugely detrimental for query performance. This means that database users and DBAs usually end up tuning databases extensively. In turn this adds both an operational and a cost overhead.
Query Optimization in Action
Let’s take a concrete example to better understand query optimization. Below is a SQL statement from a TPC-H like benchmark.
select top 20 c_custkey, c_name, sum(l_extendedprice * (1 - l_discount)) as revenue, c_acctbal, n_name, c_address, c_phone, c_comment from customer, orders, lineitem, nation where c_custkey = o_custkey and l_orderkey = o_orderkey and o_orderdate >= ':1' and o_orderdate < dateadd(mm,3,cast(':1'as datetime)) and l_returnflag = 'R' and c_nationkey = n_nationkey group by c_custkey, c_name, c_acctbal, c_phone, n_name, c_address, c_comment order by revenue;
The SQL statement finds the top 20 customers, in terms of their effect on lost revenue for a given quarter, who have returned parts they bought.
Before you run this query against your database you can find out what query plan the optimizer is going to choose and how much it is going to cost you. Figure 1 depicts the query plan for this SQL statement from SQL Server 2014 [You can learn how to generate a query plan for any SQL statement on SQL Server at https://msdn.microsoft.com/en-us/library/ms191194.aspx.
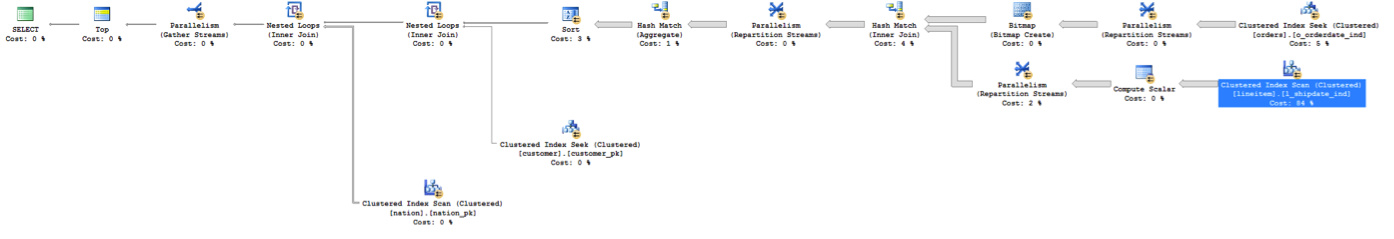
You should read the query plan from right to left. The direction of the arrow depicts the flow of control as the query executes. Each node in the plan is an operation that the database will perform in order to execute the query. You’ll notice how this query starts off with two Scans. These are I/O operations (scans) from the tables involved in the query. These scans are I/O intensive and are usually throughput bound. In data warehousing environments block sizes could be pretty large as well.
A SAN will have serious performance problems with these scans. If the data is not laid out properly on disk, you may end up with a large number of random I/O. You will also get inconsistent performance depending on what else is going on in the SAN when these scans are happening. The controller will also limit overall performance.
The query begins by performing scans on the lineitem table and the orders table. Note that the database is telling what percentage of time it thinks it will spend in each operation within the statement. In our example, the database thinks that it will spend about 84% of the total execution time on the Clustered Index Scan on lineitem and 5% on the other. In other words, 89% of the execution time of this SQL statement is spent in I/O operations! It is no wonder then that users are wary of virtualizing databases such as these.
You can get even more granular information from the query optimizer. In SQL Server Management Studio, if you hover your mouse over a particular operation a yellow pop up box will appear showing very interesting statistics. Below is an example of data I got from SQL Server 2014 when I hovered over the Clustered Index Scan on the lineitem able that is highlighted in Figure 1.
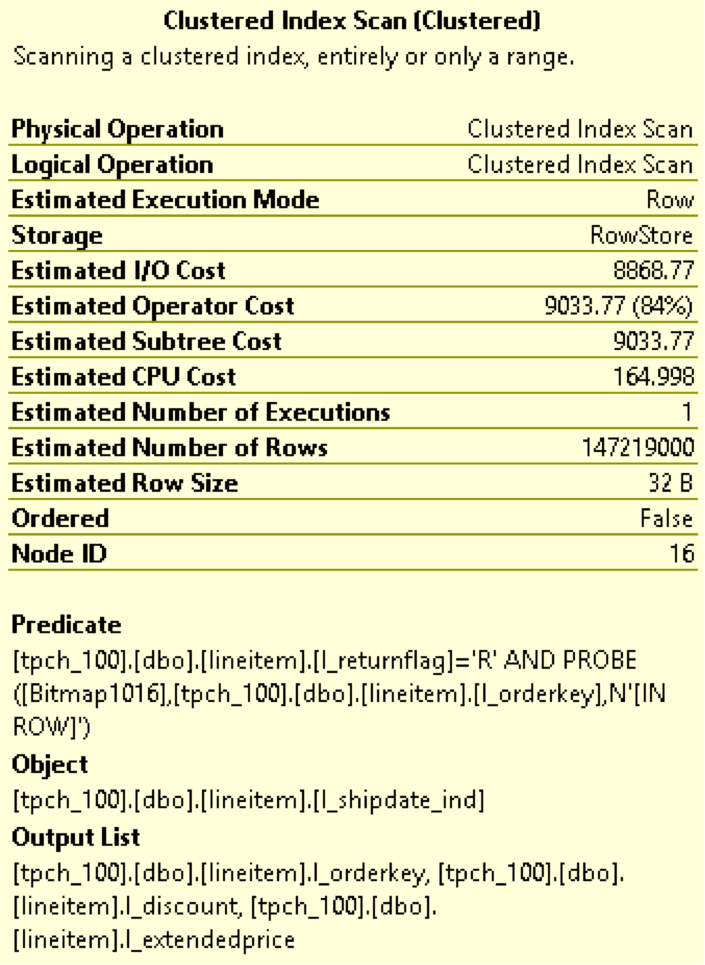
Notice how Estimated I/O cost dominates over Estimated CPU cost. This again is an indication of how I/O bound this SQL statement is. You can learn more about the fields in the figure above here.
An Operational Overhead
There is a lot one can learn about one’s infrastructure needs by understanding the query execution plans that a database generates. A typical next step after understanding the query execution plans is to tune the query or database for better performance. For example, one may build new indexes or completely rewrite a query for better performance. One may decide that certain tables are frequently hit and should be stored on faster storage or pinned in RAM. Or, one may decide to simply do a complete infrastructure rehaul.
All of these result in operational overheads for the enterprise. For starters, this model assumes someone is constantly evaluating queries, tuning the database and making sure performance isn’t impacted. Secondly, this model assumes a static environment. It assumes that the database schema is fixed, it assumes that all the queries that will be run are known before hand and that someone is always at hand to study the query and tune the database. That’s a lot of rigidity in this day and age where flexibility and agility are key requirements for the business to stay ahead.
A solution to database performance needs without the operational overhead
What if we could build out a storage performance platform that satisfies the performance requirements of the database irrespective of whether query plans are optimal, whether the schema design is appropriate or whether queries are ad-hoc or not? One imagines such a storage performance platform will completely take away the sometimes excessive tuning required to achieve acceptable query performance. The platform results in an environment where SQL is executed as needed by the business and the storage performance platform provides the required performance to meet the business SLA irrespective of query plans.
This is exactly what PernixData FVP is designed to do. PernixData FVP decouples storage performance from storage capacity by building a server side performance tier using server side flash or RAM. What this means is that all the active I/O coming from the database, both reads and writes, whether sequential or random, and irrespective of block size is satisfied at the server layer by FVP right next to the database. You are longer limited by how data is laid out on the SAN, or the controller within the SAN or what else is running on the SAN when the SQL is executed.
This means that even if the query optimizer generates a sub optimal query plan resulting in excessive I/O we are still okay because all of that I/O will be served from server side RAM or flash instead of network attached storage. In a future blog post we will look at a query that generates large intermediate results and explain why a server side performance platform such as FVP can make a huge difference.
Post originally appeared on ToddMace.io
Don’t backup. Go forward with Rubrik

Rubrik has set out to build a time machine for cloud infrastructures. I like the message as it shows that they are focused on bringing simplicity to the enterprise backup world. Last week I had the opportunity to catch up with them and they had some great news to share as they were planning to come out of stealth this week. And that day is today.
Rubrik platform
This time machine is delivered on a 2U commodity appliance that runs the Rubrik software. By installing this appliance you greatly reduce the number of machines that are necessary to provide backup and restore services today. Reducing the number of machines simplifies the infrastructure for architects and support, while the UI of Rubrik simplifies the day-to-day operations of the administrators.
User Interface
No agents are needed in the virtual datacenters to discover the workload and the user interface is centered on policy driven SLAs. Unfortunately I can’t show the user-interface, but trust me this is something you longed for a long time. Due to the pedigree of the co-founders it comes as no surprise that the Rubrik platform is fully programmable with REST API’s.
Typically moving to a new backup system introduces risk and cost. Learning curves are high, misconfigured backup configurations possibly risking data loss. Policy driven and the ability to use REST APIs ensure that the platform easily integrates in every environment. The policies are so easy to use that no training is necessary; this reduces the impact of transition to a new backup system. The low learning curve means that no countless hours are lost by figuring out how to safely backup your data, while the REST APIs allow advanced tech crews to integrate Rubrik in their highly automated service offerings.
Architecture
One thing that made me very happy to see is the Rubriks’ ability to “cloud-out” your data. Rubrik provides a gateway to AWS allowing you to send “aged data” to the cloud in a very secure way. This feature benefits the complexity reduction of local architecture. Instead of having to incorporate a tape library, you now only need an Internet connection. Having worked with a big tape libraries myself for years I know this will not only bring a lot of datacenter space back and reduce your energy bill, you WILL have way less heat to cool.
As the team understand the concept of distributed architectures thoroughly (more about that in the next paragraph) it doesn’t come as a surprise that it scales very well. The architecture can scale to 1000s of nodes. What’s interesting is that it can mount the snapshots directly on the Rubrik platform allowing virtual machines to run directly on the appliance. Think about the possibilities for development. Snapshot your current production workload and test your new code instantly without any impact on active services.
Rubrik starts off by supporting VMware vSphere and it makes sense to focus on the biggest market out there as a startup. But support for other hypervisors and cloud infrastructures (to cloud-out data) will follow.
I expect Rubrik to become a success, the product aligns with the todays enterprise datacenter requirements and the pedigree of the team is amazing. As mentioned before the co-founders have a very rich background in distributed systems, Arvind Jain was the founding Engineer of Riverbed and was a Distinguished Engineer at Google before co-founding the other three members. Interesting enough (for me at least) there are stong ties with PernixData. Prior to Rubrik, Bipul Sinha was a partner at LightSpeed before founding Rubrik. I had the great pleasure of talking to Bipul often, as he is the initial investor of PernixData. Funny enough I can recall a conversation where Bipul asked me on my view of the backup world. I believe boring and totally not sexy was my initial reply. Guess he is setting out to change that fast! The CTO of Rubrik, Arvind Nithrakashyap, worked at Oracle where he co-founded Oracle Exadata. The other Co-founder of Exadata is PernixData CEO Poojan Kumar. Last but certainly not least Soham Mazumdar, who worked at Google on the search engine and founded Tagtile.
As of today you can sign-up for the early access program. Go visit the website to read more and follow them on twitter.
Exciting times ahead for Rubrik! Don’t Backup. Go Forward!
My wish for 2015 – better tooling to provide better insight
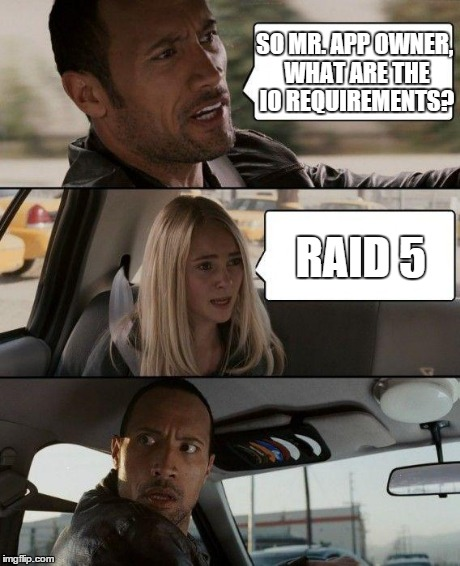
I’ve seen this image pop up quite a bit in my twitter timeline this week and it’s a very recognizable situation. Most of us have been in such conversation; I know I was when I was an Enterprise architect. And most tweets are wishing this situation changes in 2015, and I totally agree with it. However in my opinion it’s not the “app owner” who gives the wrong answer, it’s a wrong question to begin with. When I order a bread at the bakery, the baker ask what kind of bread I want, not how he needs to operate and fine tune his machinery in order to give me the product I want. Why do we think our industry, our service offering is different?
In reality, can you expect from app owners to truly understand the I/O characteristics of his application? Maybe they read all the documentation of the vendor, maybe they followed a couple of courses on how to configure and operate the application, or maybe they might even got a few certifications under their belt. But in reality there are no classes and courses in the dynamics of the workload you are running. The application stack is merely a framework in order to delivery a service to the business you are servicing.
The dynamics of workload is very complex, especially in a virtualized datacenter. Typically enterprise applications do not generate a consistent workload pattern. These patterns are different when servicing users or when interacting with infrastructure services. During their life cycle, applications are updated, code/query improves impacting application behaviour. Pete Koehler wrote down his experience in his article “Using a new tool to discover old problems”.
Besides generating a variety of different workload patterns, applications are subject to change during its lifecycle. Change in interaction and demand, impacting the underlying infrastructure differently throughout time. Typically an application experiences a lot of interaction during test/dev/acceptance process before going into production. After the introduction period, demand is low but increasing. During the maturity of the application, demand will peak. At one point application will be replaced and is phased out. During this phase workload demand will taper off, but the service still demands a particular level of service. During all these phases, the infrastructure needs to provide the service the organization demands. And this is just an isolated case of one particular application.
Typically the virtual datacenter infrastructure is shared. A virtual machine containing an application lands on a storage array, typically storing multiple virtual machines on that datastore. The datastore is backed by a LUN, backed by multiple physical devices. Access to the devices is done via shared controllers and the list continues all the way up the stack to hypervisor. Maybe the application owner understands what type of I/O the application is generally producing, but the underlying stack will impact the performance. Can you ensure the application gets the performance it requires? Do you know if the infrastructure is capable of delivering the service the application requires? And what about the impact of the application on the infrastructure. How will introducing this application impact the current active applications? Will it impact their service levels?
Therefor I believe that two things need to change, behavior and tooling. IT needs to switch from asking technical questions to asking functional questions. It’s better to understand the role and place in the business process. Typically this provides insight on the availability, concurrency and response requirements of the application. The second thing that needs to change, and this is what I hope 2015 will bring, is better tooling that provides insight on workload characteristics. Tooling that provides better analysis of application demand and it’s impact on infrastructure. At this stage, most tooling is ineffective in proving proper information. Virtualized Datacenters need tooling that provides a better view into the theatre of consumers and producers. Tooling that provides a more holistic view of the application workload characteristics while being able to monitor the resource usage. Having such tools allows IT departments to operationalize and manage their environments much better, ensuring proper service levels while being able to understand the capability of the environment. Looking at the current developments in the IT industry, it is incredible difficult to predict what type of workloads (and especially in what form/platform) will hit the enterprise IT landscape in the next two years. Understanding what your environment truly delivers is a necessity when discussing future workloads.
I think this is a necessary step for datacenter advancements. Once you know what’s going on, once you got proper tooling to provide better insights you can feed this data into advanced algorithms to distribute the load across the infrastructure to provide the performance it requires while optimizing resource utilization. All of this providing the correct priority aligning it with business needs. This goes beyond todays offering such as DRS, Storage DRS, SIOC in vSphere datacenters and Mesos in container landscapes.
Interesting IT related documentaries
The holidays are upon us and for most its time to wind down. Maybe time for some nice though-provoking documentaries before the food-coma sets in. 😉 Most of the documentaries listed here are created by Tegenlicht (Backlight). Backlight provides some of the best documentaries on Dutch television and luckily they made most of them available in English. The following list is a set of documentaries that impressed me. If you found some awesome documentaries yourself, please leave a comment.
Tech revolution on Wall Street
Backlight created a trilogy on the tech revolution on Wall Street over a period of three years. The most famous one is the second one, “Money and Speed, inside the black box”. It received multiple awards and although it’s the second documentary in the series of three, I recommend starting with that one. If you are intrigued about how the impact of these algorithms, continue with the other two episodes, “Quants. The alchemists of Wall Street” and “Wall Street Code”. They almost make you feel like you are watching a thriller, highly recommended!
08.02.2010: Quants, The alchemists of Wall Street. English | Dutch
20.03.2013: Money & Speed: Inside the Black Box. English | Dutch
04.11.2013: Wall Street Code. English | Dutch
Extra video
08.02.2010: Quants, George Dyson. English
01.07.2011: Kevin Slavin: How algorithms shape our world. English (Ted Talk)
Unfortunately these two documentaries are Dutch only.
21.10.2013: Big Data, the Shell Search. Dutch
Tegenlicht onderzoekt hoe je met behulp van big data kunt doordringen in gesloten bolwerken. Wat geven deze enorme informatiestromen prijs over een multinational als Shell?
1.10.2014: Zero Days veiligheidslekken te koop Dutch
Tegenlicht neemt je mee in de handel van ‘zero days’, onbekende lekken in software of op het internet. Een strijd tussen ‘white hat’ en ‘black hat’ hackers bepaalt onze online veiligheid.
Although the voice over is Dutch, most of this documentary is in English, you might want to give it a try. It focuses on legal trade of unknown security vulnerabilities, so called zero days. Yes your government is also acquiring these from hackers, all perfectly legal!
Enjoy! And of course I wish you all happy holidays!
MS Word style formatting shortcut keys for Mac
Recently I started to spend a lot of time in MS word again, and as a stickler for details I dislike a mishmash of font types throughout my document. I spend a lot of time on configuring the styles of the document, yet when I paste something from other documents, MS word tend to ignore these. Correcting the format burns a lot of time and it simply annoys the crap out of me.
To avoid this further, I started to dig around to find some font and style related shortcut keys. Yesterday I tweeted the shortcut key to apply the normal style and by the looks of retweets many of you are facing the same challenge.
Below is a short list of shortcut keys that I use. There are many more, share the common ones you like to use. As I use Mac I listed the Mac shortcut combination. Replace CTRL for CMD if you are using MS Word on a windows machine.
Select text:
Select all: CTRL+A
Select sentence: CMD + click
Select word: Double click
Select paragraph: Triple click
Formatting:
Clear formatting: CTRL+spacebar
Apply Normal Style: Shift+CMD+N
Header 1: CMD+ALT+1
Header 2: CMD+ALT+2
Header 3: CMD+ALT+3
Change Case: CMD+Option+C (repeat combination to cycle through options)
Indent paragraph: CTRL+Shift+M
Remove indent: CMD+Shift+M
Find and replace: F5