Today I’ve updated my vCenter Server Appliance with the VC-6.0.0U1b-Appliance.ISO in my lab. After rebooting I was surprised to see the error “You do not have permissions to view this object” on almost every object in the inventory screen.
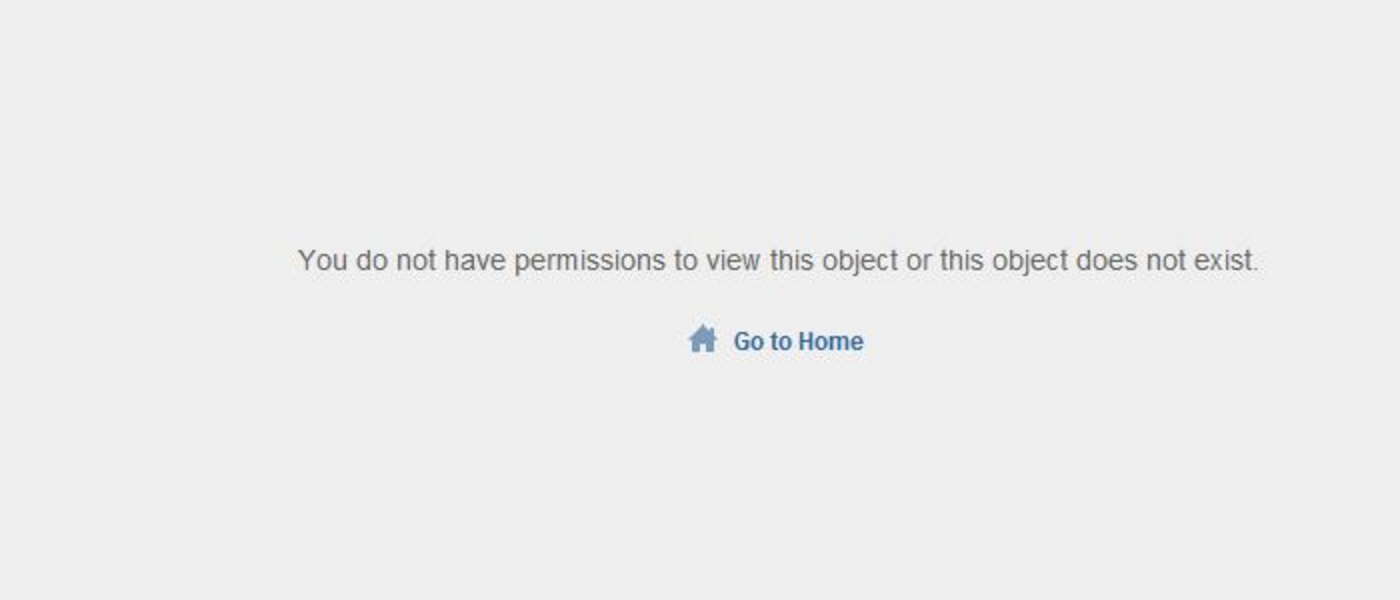
Unfortunately a reboot of the DC (home lab, I do not run an elaborate AD here)Time to google and it seems that a lot of other people have hit this bug. After googling some more I found the the VMware KB article: KB 2125229.
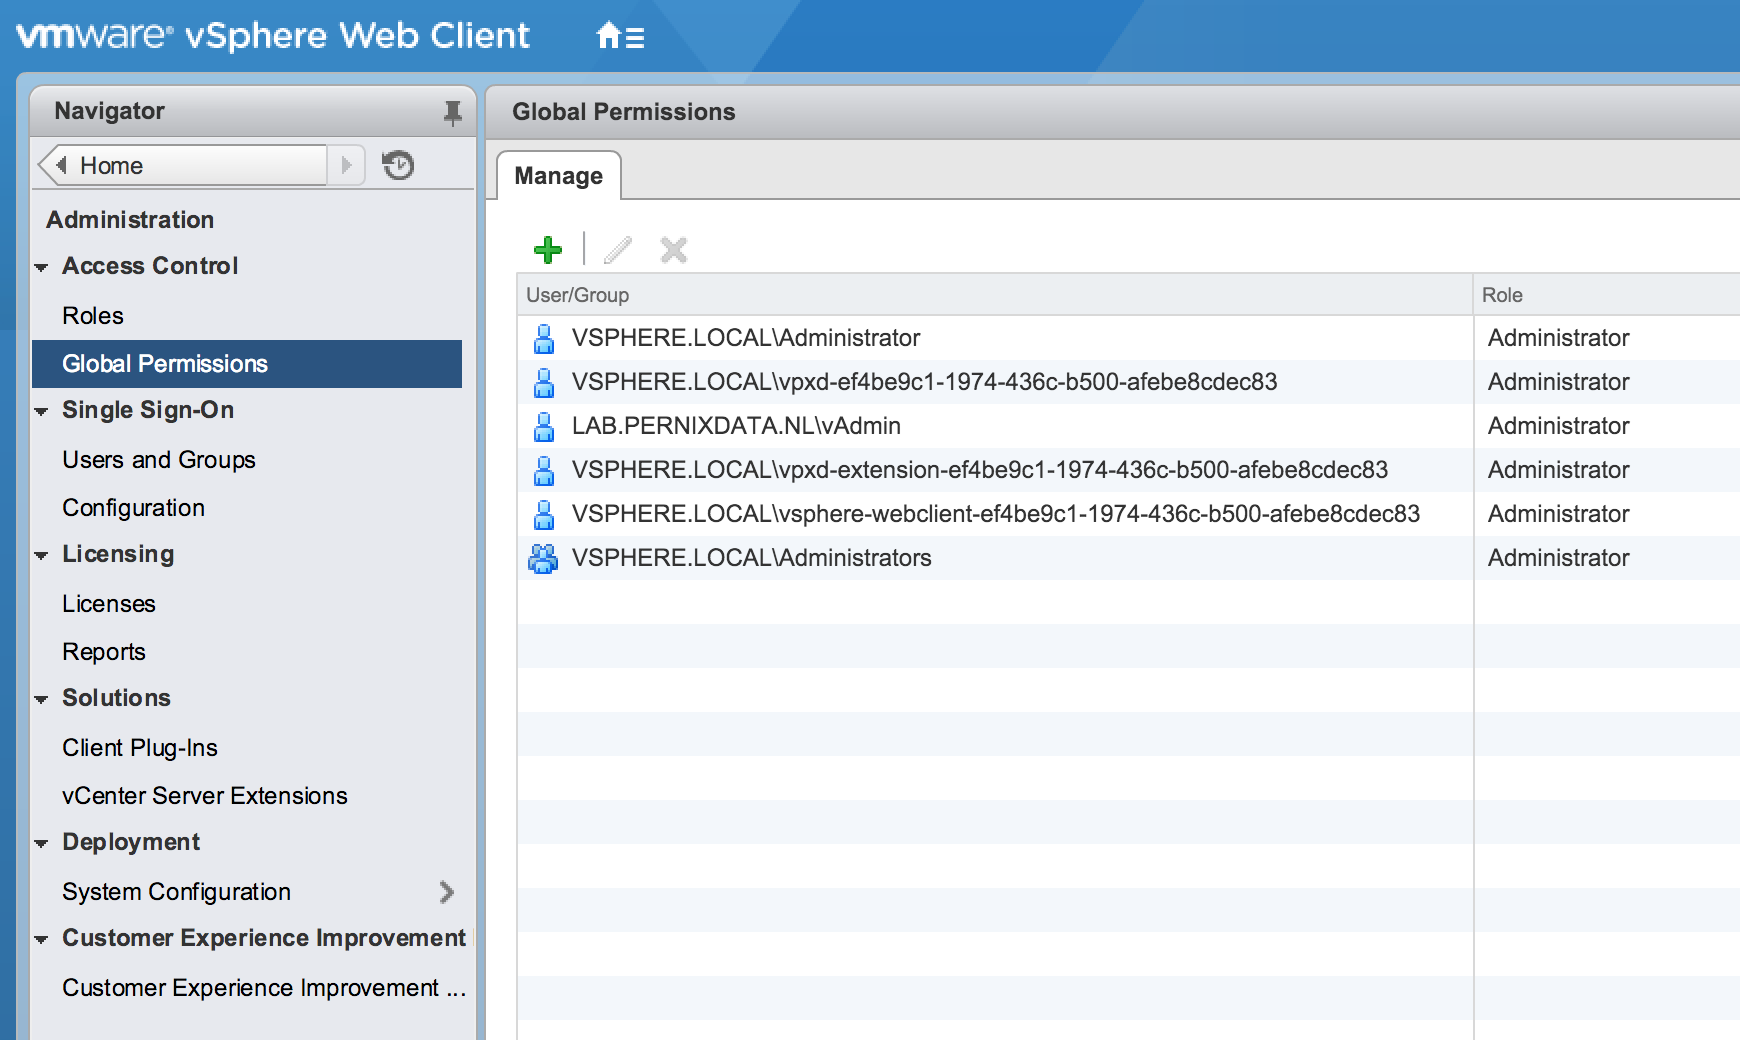
Problem is, this is solely focused on the windows version of vCenter and not focussed on solving the problem occurring on the VCSA. Although I can log in and see the inventory when using my admin account (Lab\vAdmin) I can’t access the objects. Maybe a permission problem? When checking the global permissions the (vAdmin) user is still listed as an administrator.
However administrators should be able to access all objects, as I found out a refresh is required. Here is how I solved it:
1. Log out of vC and login with the default admin account “administrator@vsphere.local”
2. In the Home view, select “Administration” from the menu
3. Go to Global Permissions, remove the user (In my case vAdmin)
4. Click on “Add Permission”
5. Select your AD domain and select the correct user
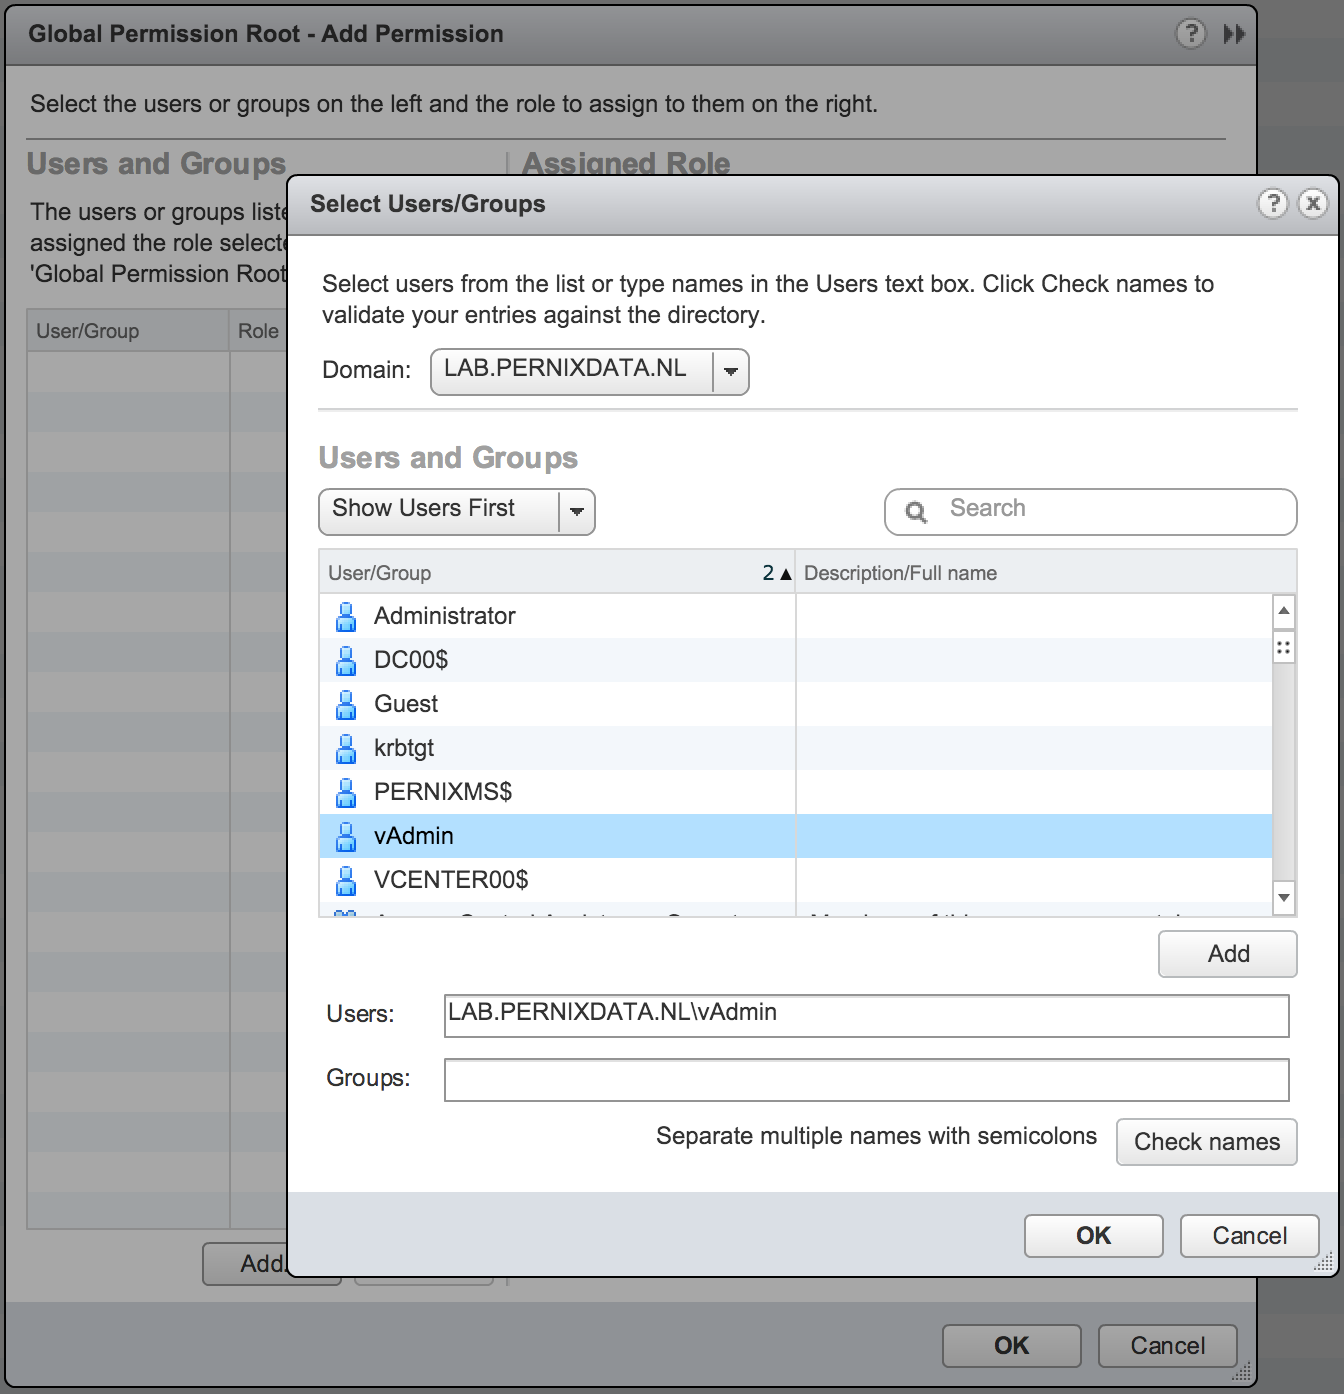
6. Click on Ok
7. Check the list to see whether your user is added with the correct role (administrator).
8. Logout and login with the correct AD user.
9. Back to work.
Time for me to power on these servers again.
Follow Frank on twitter @frankdenneman
When your Home Lab turns into a Home DC
A little bit over a year ago I decide to update my lab and build two servers. My old lab had plenty of compute power, however they were lacking bandwidth, 3 Gbit/s SATA and 1 Gb network bandwidth. I turned to one of the masters of building a home lab, Erik Bussink, and we thought that the following configuration was sufficient to handle my needs.
Overview
| Component | Type | Cost |
| CPU | Intel Xeon E5 1650 v2 | 540 EUR |
| CPU Cooler | Noctua NH-U9DX i4 | 67 EUR |
| Motherboard | SuperMicro X9SRH-7TF | 482 EUR |
| Memory | Kingston ValueRAM KVR16R11D4/16HA | 569 EUR |
| SSD | Intel DC 3700 100GB | 203 EUR |
| Power Supply | Corsair RM550 | 90 EUR |
| Case | Fractal Design Define R4 | 95 EUR |
| Price per Server | (without disks) | 1843 EUR |
The systems are great, but really quickly I started to hit some limitations. Limitations that I have addressed in the last year, and that are interesting enough to share.
Adding a third host
As FVP is a scale out clustered platform, having two hosts to test with simply just don’t cut it. For big scale out testing I use nested ESXi but to do simple tests I just needed one more host. The challenged I faced was the dilemma of investing in “old” tech or going with new hardware. Intel updated their Xeon line to version 3, the Intel Xeon v3 has more cache (from 12MB to 15MB) more memory bandwidth, increased max memory support up to 768GB and uses DDR4 memory. (Intel ark comparison)
New shiny hardware might be better, but the main goal is to expand my cluster and one of the things I believe in is a uniform host configuration within a cluster. Time is a precious resource and the last thing I want to spend time on is to troubleshoot behavior that is caused by using non-uniform hardware. You might win some time by having a little bit more cache, more memory bandwidth but once you need to troubleshoot weird behavior you lose a lot more.
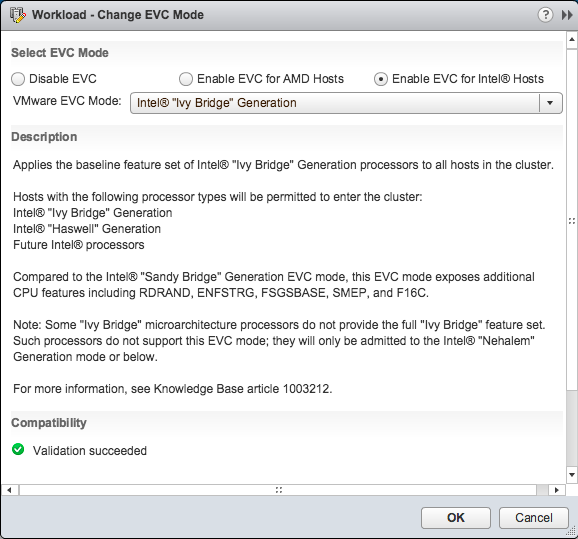
A dilemma is not a dilemma if you go back and forth between the options, thus I researched if it was possible. The most predominant one is the change in CPU microarchitecture. The v3 is part of the new Intel Haswell microarchitecture. The Xeon v2 is build upon the Ivy Bridge. That means that the cluster has to run in EVC mode Ivy Bridge. The EVC dialog box of the cluster indicates that Haswell chips are supported in this EVC mode, thus DRS functionality remains available if I go for the Haswell chip
The Haswell chip uses DDR4 memory and that means different memory timings and different memory bandwidth. FVP can use memory as a storage I/O acceleration resource and a lot of testing will be done with memory. That means that applications can behave differently when FVP decides to replicate fault tolerant writes to the DDR4 host or vice versa. In itself it’s a very interesting test, thus again another dilemma is faced. However, these tests are quite unique and I rather have uniform performance across the cluster and avoid any troubleshooting behavior due to hardware disparity.
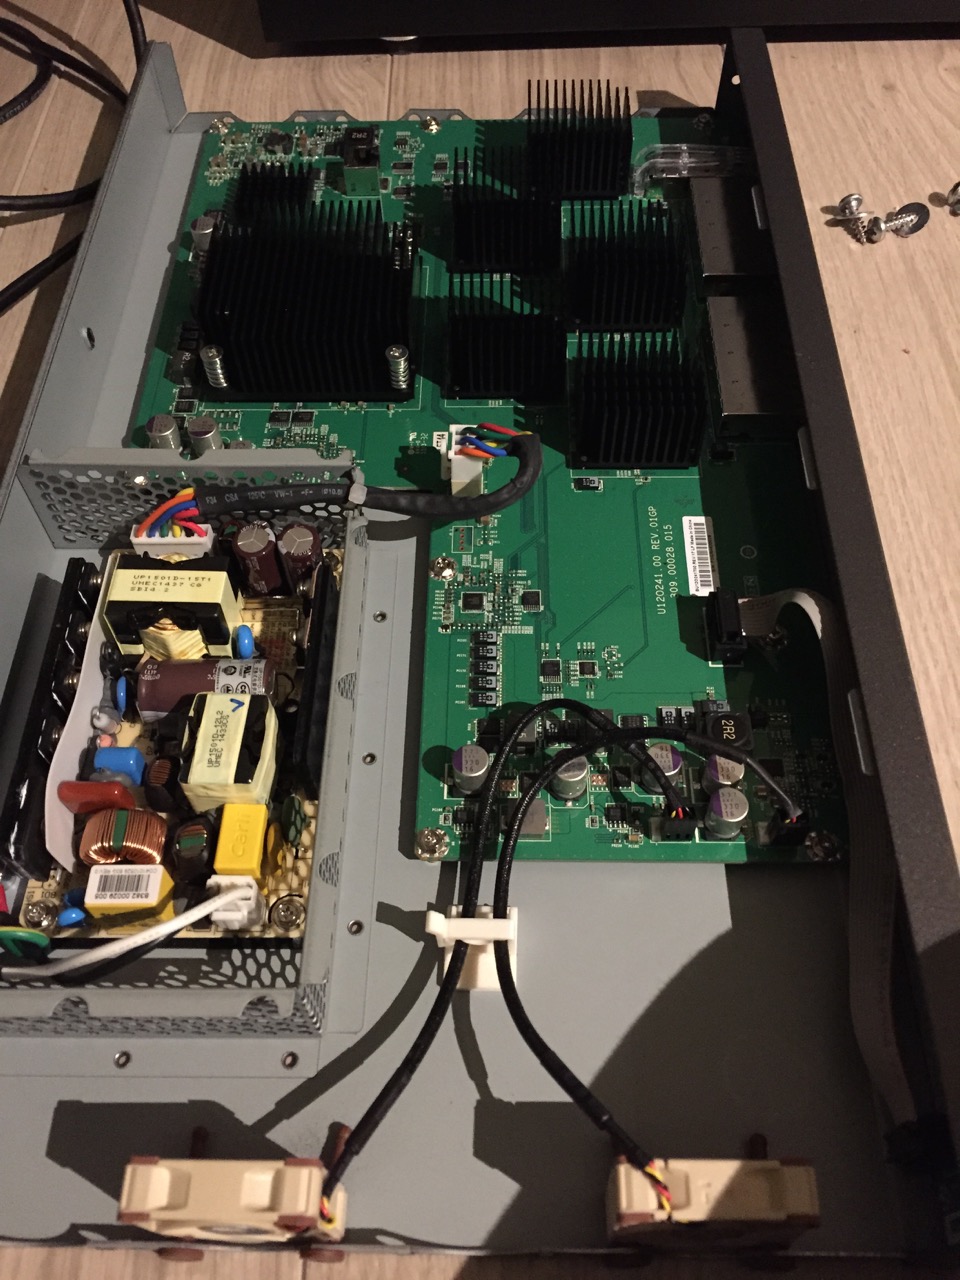
Due to the difference in memory type, a new Motherboard is required too. That meant that I have to find a motherboard that contains the same chipsets and network configuration. The SuperMicro X9SRH-7TF rocks. Onboard 10 GbE is excellent. Some other users in the community have reported overheating problems, Erik Bussink was hit hard by the overheat problem and bought another board just to get rid of weird errors caused by the overheating. That by itself made me wonder if I would buy another X9SRH-7TF or go for a new Supermicro board and buy a separate Intel X540-T2 dual port 10GbE NIC to get the same connectivity levels.
After weighing the pros and cons I decided to go for the uniform cluster configuration. Primarily because testing and understanding software behavior is hard enough. Second-guessing whether behavior is caused by the hardware disparity is a time sucking beast and even worse, it typically kills a lot of joy in your work. Contrary to popular belief, prices of older hardware does not decline forever, due to availability of newer hardware and remaining stock, prices go up. The third host was almost 500 Euro’s, more expensive than the previous price I had to pay.
Networking
Networking is interesting as I changed a lot during the last year. The hosts are now equipped with an Intel PRO 1000 PT dual ports with the 82571 chip. Contrary to my initial post these are supported by vSphere 5.5.
However network behavior is a large part of understanding scale out architectures, thus more NIC ports are needed. An additional HP NC365T Quad-port Ethernet Server Adapter was placed in each server. The HP NIC is based on the Intel 82580 chipset but is a lot cheaper than buying Intel branded cards. Each host has one NIC dedicated to IPMI, 2 10GbE ports and 6 1GbE. In hindsight, I would rather go for two Quad NIC cards as it allows me to setup different network configurations without having to tear them down each time.
With the introduction of the third host I had to buy a 10GbE switch. The two host were directly connected to each other, however this configuration is not possible with three hosts. Thus I had to look for a nice cheap 10GbE switch that doesn’t break the bank and is quiet. Most 10GbE switches are made for the data center where noise isn’t really a big issue. My home lab is located in my home office, spending most of my day with something that sounds like a jet plane is not my idea of fun. The NETGEAR ProSafe Plus XS708E 8-port 10-Gigabit fit most of my needs. 8 ports for less than 900 euro’s, it’s kind of a steal compared to the alternatives. However I wasn’t really impressed by the noise levels (and spending 900 euro’s but that’s a different story). Again my main go-to-guy for all hardware related questions Erik Bussink provided the solution, the Noctua NF-A4-x10 FLX coolers. Designed to fit into 1U boxes they were perfect.
But as you can see the design of the Netgear is a bit weird. The coolers are positioned at the far end of the PCB with all the heatsinks. When the switch is properly loaded, the thing emits a lot of heat. Regardless of what type of internal fan is used. To avoid heat buildup in the switch I used simple physics, but I will come to that later.
Now having three hosts with seven 1 GbE connections, two storage systems eating up 3 ports and an uplink to the rest of the network I needed a proper switch. Lessons learned in that area, research thoroughly before pressing the buy button. I started of with buying an HP 1810-24G v2 switch. Silent, 24 ports, VLAN support. Awesome! No not awesome because it couldn’t route VLANs. And to the observant reader, 25 ports required, 24 ports offered. A VCDX’esque-like constraint. To work around the 24 ports limitation I changed my network design and wrote some scripts to build and tear down different network configurations. Not optimal, but dealing with home labs is almost like the real world.
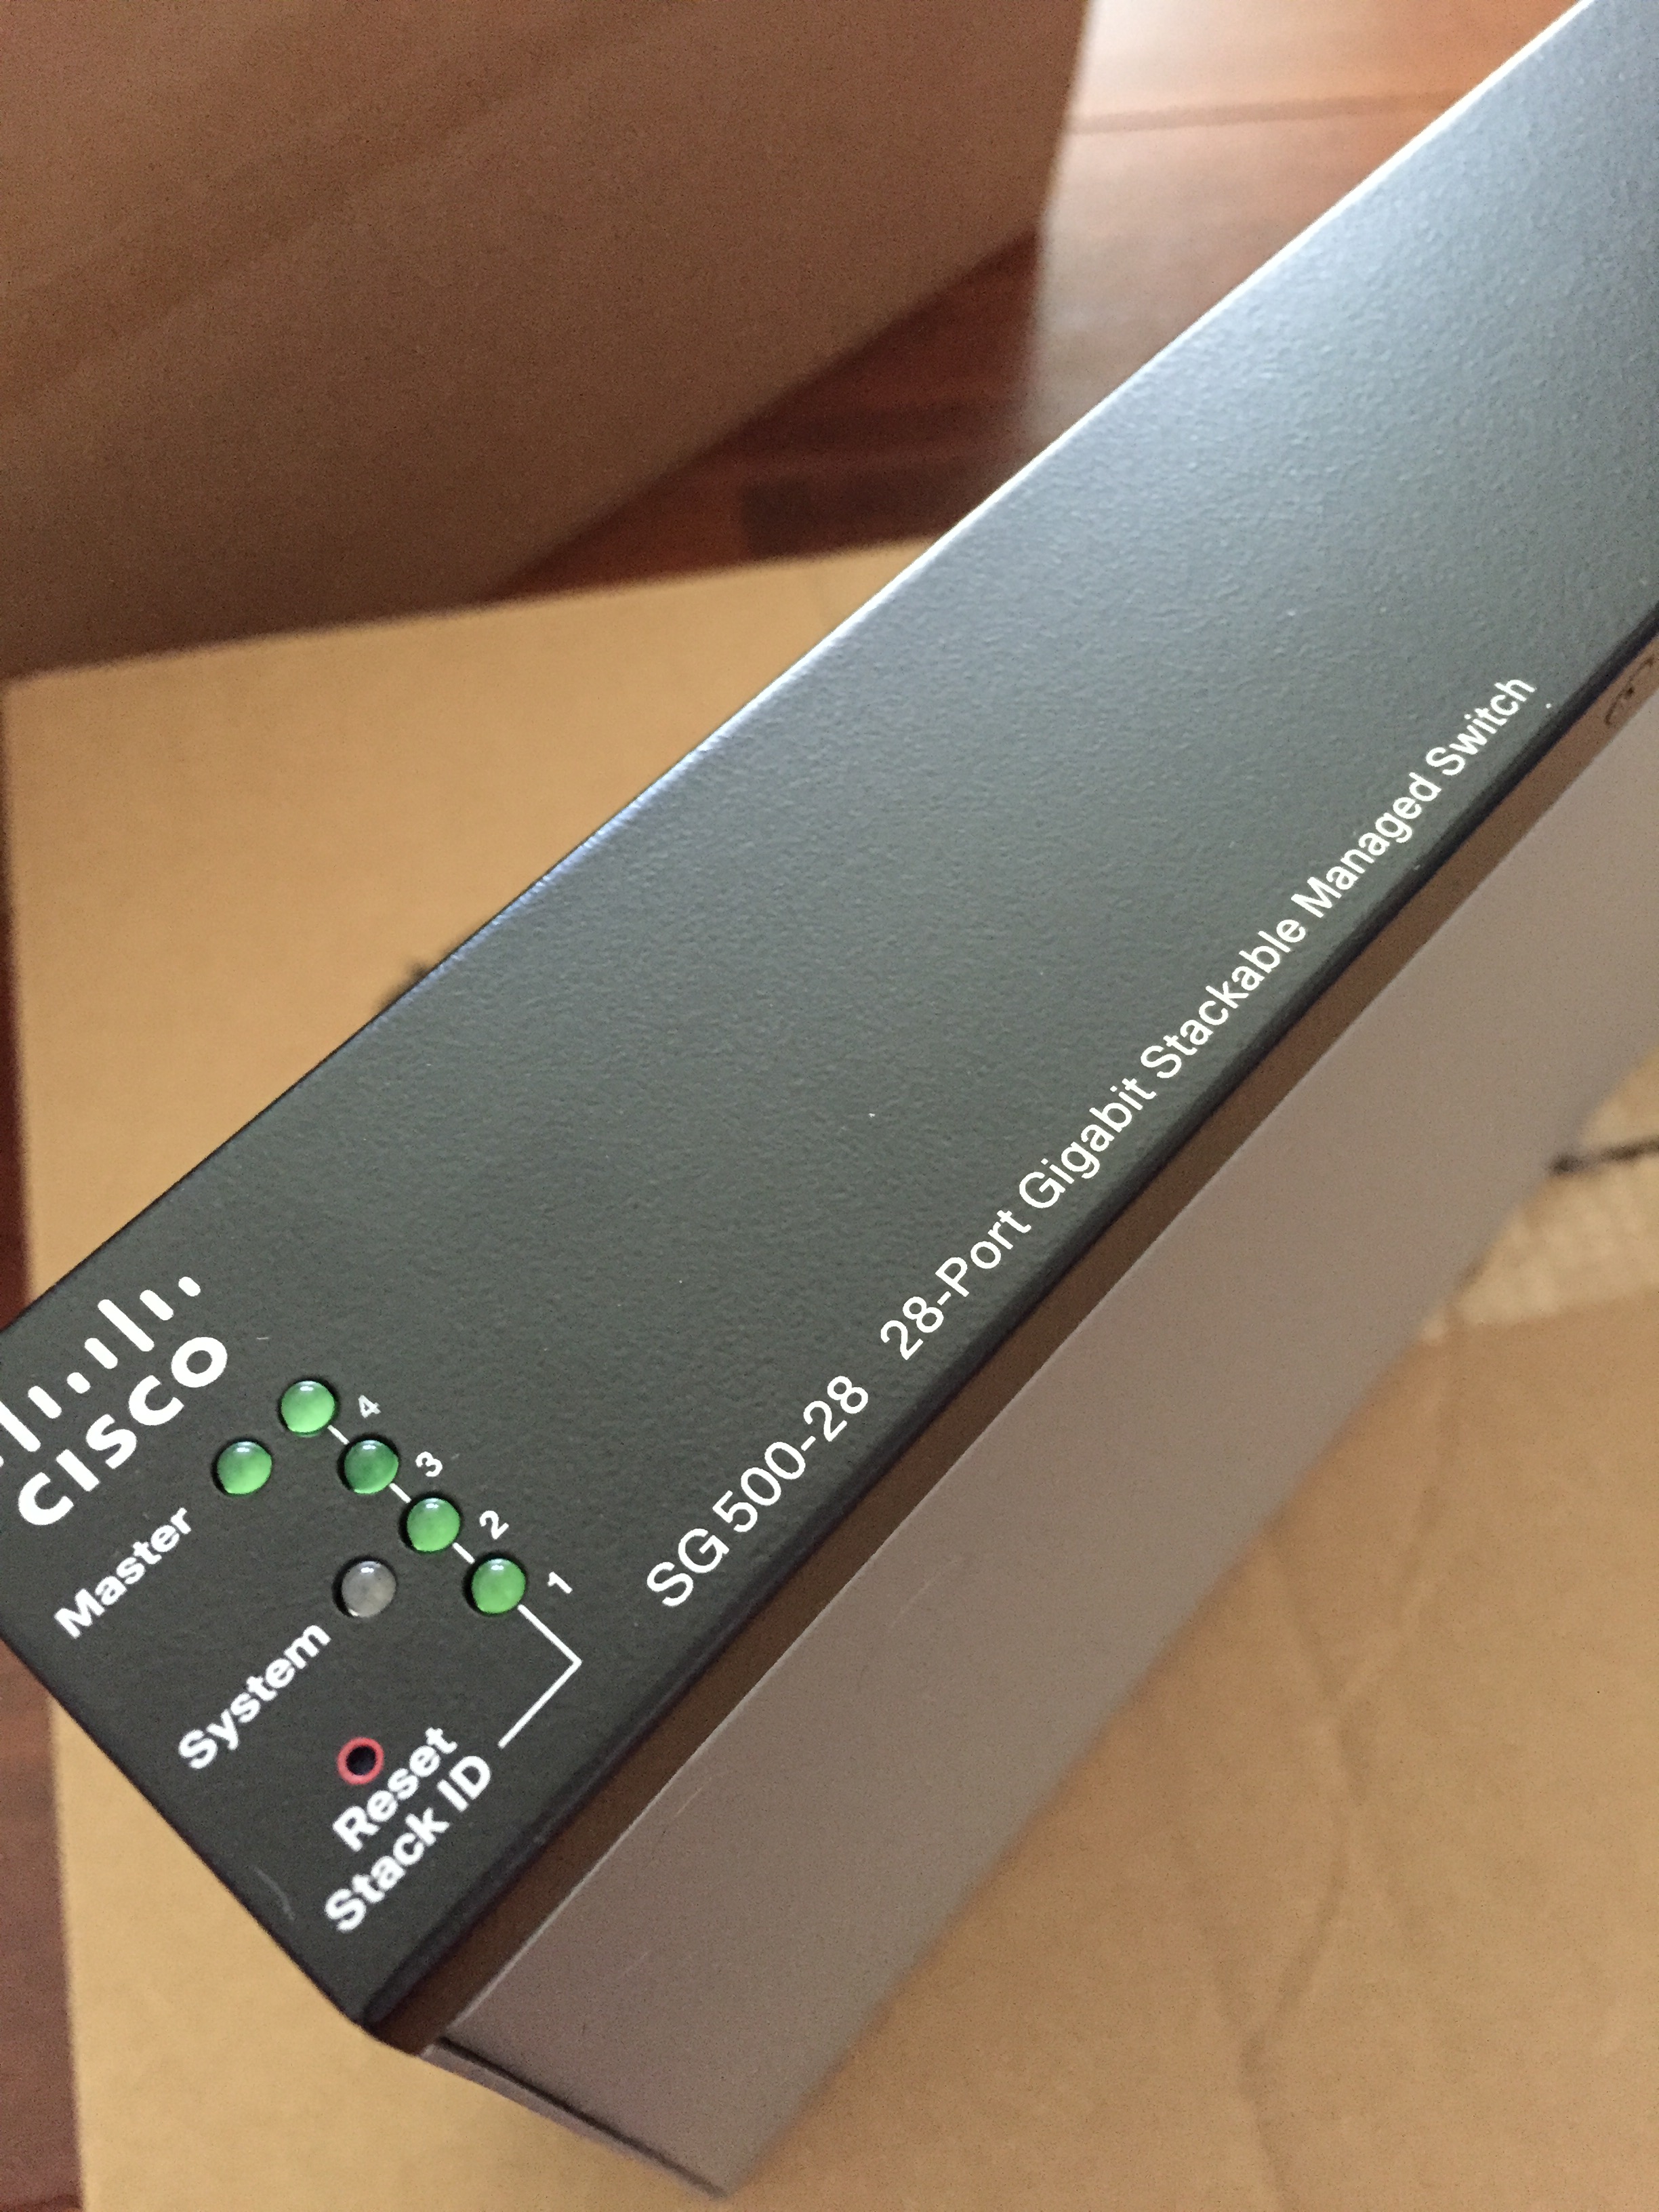
While testing network behavior and hitting the VMkernel network stack routing problem I decided it was time to upgrade my network with some proper equipment. I asked around in the community and a lot where using the Cisco SG300 series switch. Craig Kilborn on twitter blogged about his HP v1910 24G and told me that it was quite noisy. A Noctua hack might do the trick, but I actually wanted some more ports than 24. Erik pointed out the Cisco SG500-28-K9-G5 switches that are stackable and fanless. Perfect! I could finally use all the NICs in my servers and have room for some expansion.
Time for a new rack
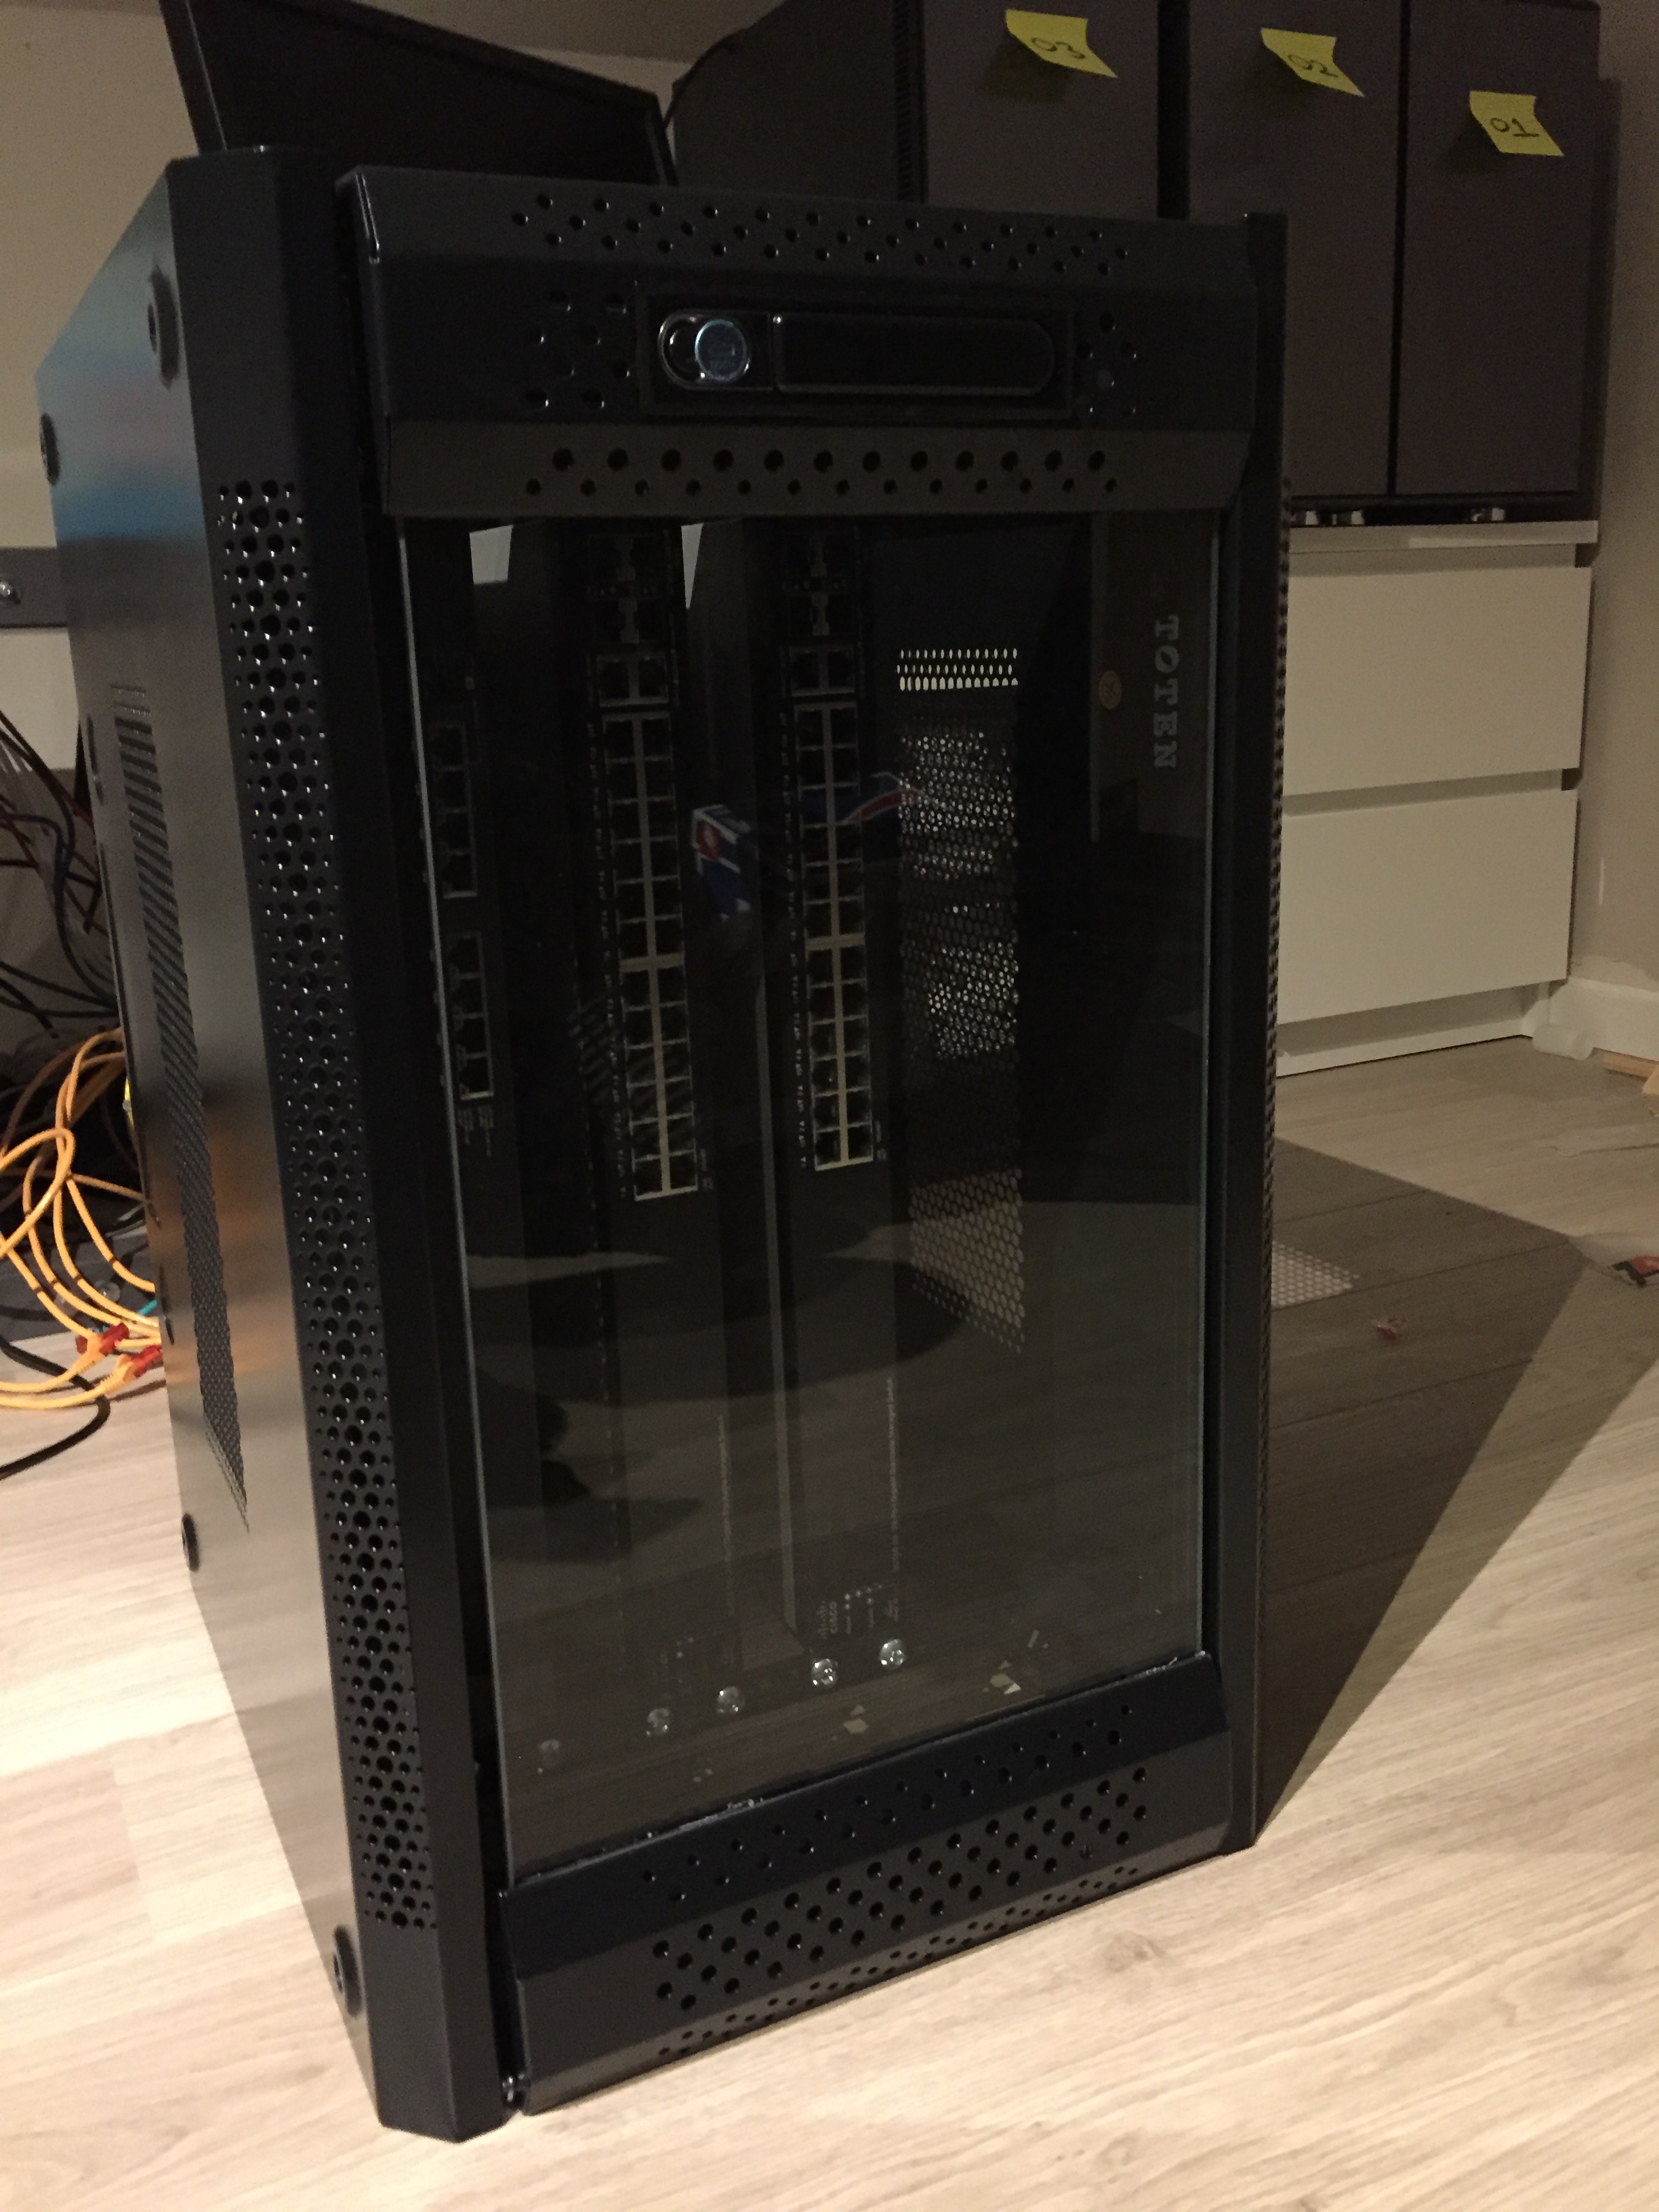
So from this point on I have three 19” sized switches, the IKEA lack hack table was nice, but these babies deserved better. The third host didn’t fit the table therefor new furniture had to be bought anyways. After spending countless of hours looking at 19” racks I came across a 6U Patch case.

This case had a lockable glass door (kids) and removable side panels, perfect for my little physics experiment. Just place the case in an upright position, remove the side panels and let the heat escape from the top. The fans will suck in “cold” air from the bottom. The dimensions of the patch case were perfect as it fitted exactly in my setup. The case is an Alfaco 19-6406. But with this networking equipment I’m feeling that my home lab is slowly turning into a #HomeDC.
With all this compute and network power I wanted to see what you can do when you have enterprise grade flash devices. I’m already using the Intel DC S3700 SSD’s and I’m very impressed by their consistent high performance. However Intel has released the Intel SSD DC p3700 PCIe card that use NVMe. I turned to Intel and they were so generous of loaning me three of these beasts for a couple of months. The results are extremely impressive, soon I will post some cool test results, but imagine seeing more than 500.000 IOPS in your homeDC on a daily basis.
Management server
To keep the power bill as low as possible, all three hosts are shutdown after testing, but I would like to have the basic management VMs running. In order to do this, I used a Mac Mini. William wrote extensively about how to install ESXi on a Mac, if you are interested I would recommend to check out his work: http://www.virtuallyghetto.com/apple. Unfortunately 16Gb is quite limited when you are running three windows VMs with SQL DB’s, therefor I might expand my management cluster by adding another Mac Mini. Time to find me some additional sponsors. 🙂
Ballooning, Queue Depths and other back pressure features revisited
Recently I’ve been involved in a couple conversations about ballooning, QoS and queue depths. Remarks like ballooning is bad, increase the queue depths and use QoS are just the sound bits that spark the conversation. What I learn from these conversations is that it seems we might have lost track of the original intention of these features.
Hypervisor resource management
Features such as ballooning and queue depths are invented to solve the gap between resource demand and resource availability. When a system experiences a state where resource demand exceeds the resources it controls the system has a problem. This is especially true in systems such as a hypervisor where you cannot control the demand directly. A guest operating system or an application in a virtual machine can demand a lot of resources. The resource management schedulers inside the hypervisor are tasked to fulfilling the demand of that particular machine while at the same time satisfy the resource demand of other virtual machines. Typically the guest OS resource schedulers are not integrated with the hypervisor resource schedulers, this can lead to a situation in which the administrator typically resorts to taking draconian measures. Measures such as disabling ballooning, increasing the queue-depth to become the digital equivalent of the Mariana trench.
Sometimes it is taken for granted, but resource management inside the hypervisor is actually a though challenge to solve. Much research is done on solving this problem; a lot of research papers trying to find an answer to this challenge are published on a monthly basis. Let’s step back and take a look from an engineer perspective (or should I say developer?) and see what the problem is and how to solve it in the most elegant way. It’s an architect job to understand that this functionality is not a replacement for a proper design. Let’s start by understanding the problem.
Load-shedding or back pressure
When dealing with the situation where resource demand exceeds resource availability you can do two things. Well if you don’t do anything, it’s likely to encounter a system failure that can affect a lot more than only that particular resource or virtual machines. Overall you don’t design for system failure, you want to avoid it and to do so you can either drop the load or apply some form of back pressure. I think we all agree that dropping load, sometimes referred to as load-shedding is not the most elegant way of dealing with temporary overload, that’s why a lot of effort is going into back pressure features.
A back pressure feature that everyone is familiar with is the memory balloon driver. Guest OS memory schedulers deal with used and free memory in such a way that this is transparent to the hypervisor. When the hypervisor is running out of physical machine memory it needs to figure out a way to retrieve memory. By using the balloon driver, the hypervisor asks the guest OS memory scheduler to provide a list of pages that it doesn’t use or doesn’t deem as important. After getting the info, the hypervisor proceeds to free up the physical memory pages to be able to satisfy incoming memory requests. Instead of dropping the new incoming workload it applies a back pressure system in the most elegant way. I don’t know why people are still talking about ballooning as bad. The feature is awesome, it’s the architect / sys admin job to come up with a plan to avoid back pressure in the system. Again the back pressure feature is not substitute for proper design and management.
But the most misunderstood back pressure feature could be queue-depths. Sometimes I hear people refer to queue depths as a performance enhancement. And this is not true. It just allows you to temporarily deal with I/O overload. The best way to have a clear understanding of queue depths is to use the bathroom sink analogy.
The drain is the equivalent of the data path leading to the storage array, the sink itself is the queue sitting on top of the data path / drain. The faucet represents the virtual machine workloads. Typically you open up the faucet to a level that allows the drain to cope with the flow of water. Same applies to virtual machine workloads and the underlying storage system. You run an x amount of workload that is suitable for your storage system. The moment you open up the faucet more your sink will fill up and at one point your sink will overflow. Thus you have to do some back pressure mechanism. In the bathroom sink world this typically is done by flowing the water back into the second sink. In the I/O scheduler world this typically resolves in a queue full statement. This typically bogs down the performance of the virtual machine so much that many admins/architect resolve by increasing the queue depth. Because this allows them to avoid the queue full state (temporarily) But in essence you just replaced your bathroom sink by a bigger sink, or something when people go overboard the increase the queue depth to the digital equivalent of a full size bathtub. This bathtub impacts a lot of other workloads as many workload now end up at the top of the queue instead of the deeper part, waiting their turn to go through the drain to the storage system. Result: latency increases in all applications due to improper designed systems. And remember when the bathtub overflows you typically have a bigger mess to deal with.
Back pressure features are not a substitute for proper design, therefor think about implementing a bigger drain of even better multiple drains. More bandwidth or just more data paths to the same storage system lead to a short delay of seeing the same back pressure problem again, it just occurs on a different level. Typically when a storage controller fills up its cache, it sends a queue full to all the connected systems, so the problem has now evolved from a system wide problem to a cluster wide problem. This is one of the big reasons why scale out storage systems are a great fit in the virtual datacenter. You create drains to different sewer system typically in a more plan-able manner. If you are looking for more information about this topic, I published a short series on the challenge of traditional storage architectures in virtual datacenters.
Quality of Service faces the same predicament. QoS is a great feature dealing with temporary overload, but again, it is not a substitute for a proper design. Back pressure features are great, it allows the system to deal with resource contentions while avoiding system failures. These features are unmissable in the dynamic virtual datacenter of today. When detecting that these features are activated on a frequent basis, one must review the virtual datacenter architecture, the current workloads and future workloads.
I think overall it all boils down to understand the workload in your system and have an accurate view of the capabilities of your systems. Proper monitoring and analytics tools are therefore indispensable. Not only for daily operations but also for architects dealing with maintaining a proper service level for their current workloads while architecting an environment that can deal with unknown future workloads.
VMware Tools is out of date on this virtual machine while summary states Current
For some apparent reason all my virtual machines show an alert that the VMware tools is out of date. While the summary states that its running the current version
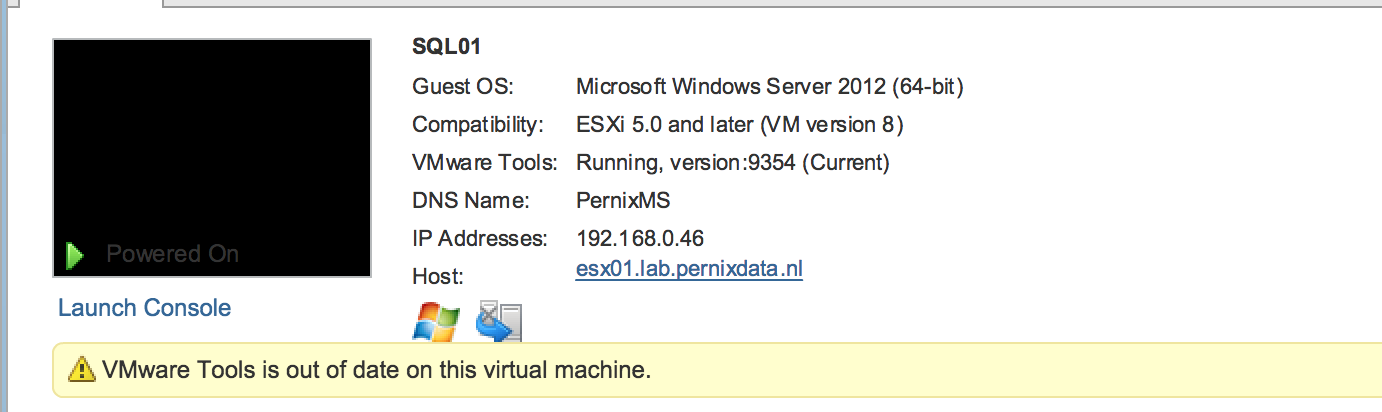
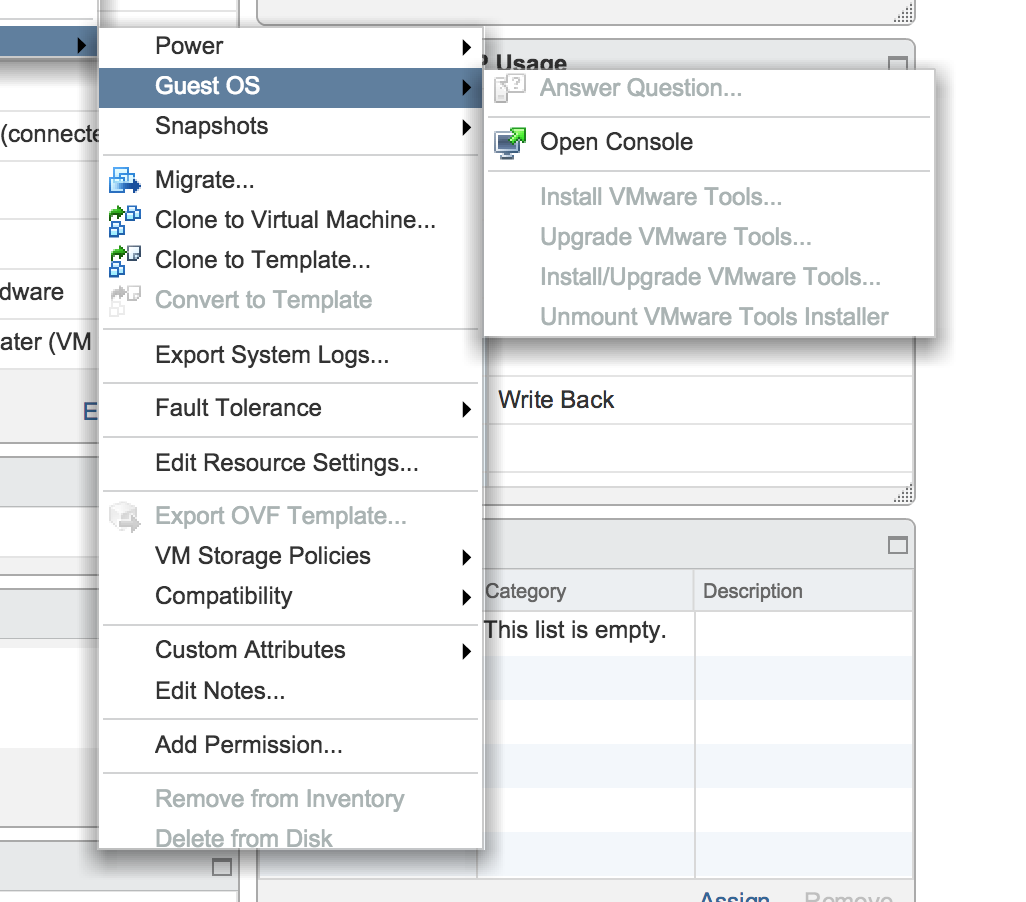
When trying to upgrade the VMware tools, all options are grayed out:
It appears to be a cosmetic error but I stil wanted to know why it shows the alert on my virtual machines.
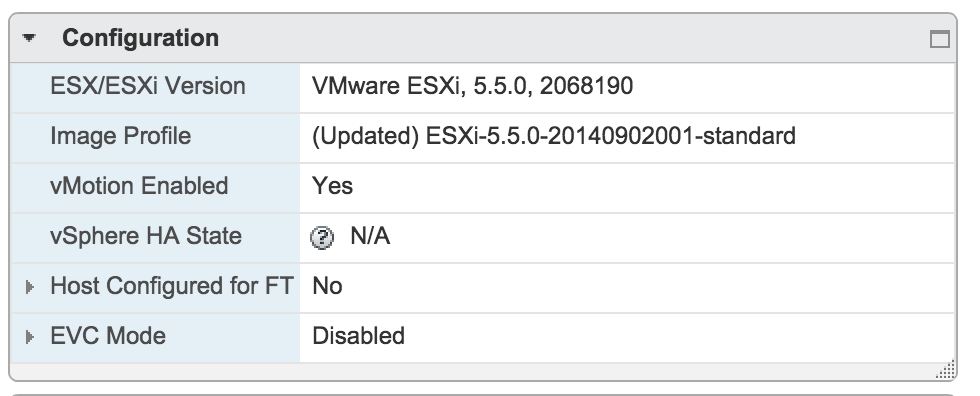
As it turns out I created my templates on my management cluster host (lab) and that host runs a newer version of vSphere 5.5 (2068190)
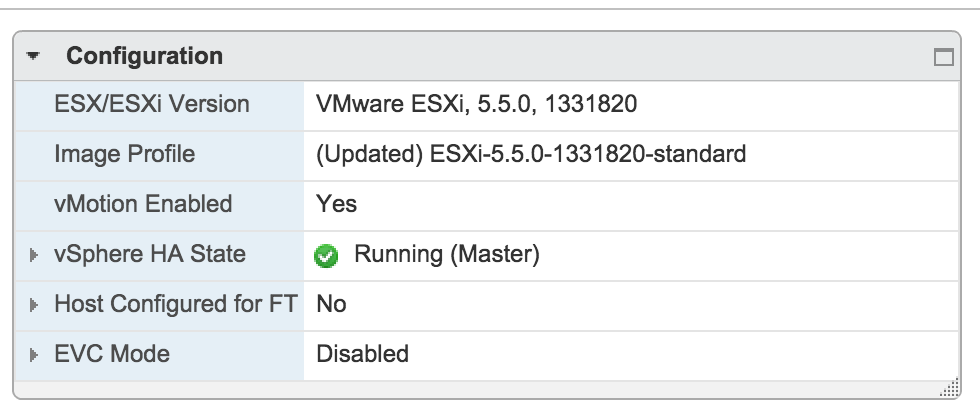
My workload cluster host run a slightly older version of vSphere 5.5 and it uses a different version of VMtools.
The VMtools version list helps you to identify which version of VMtools installed in your virtual machine belongs to which ESXi version: https://packages.vmware.com/tools/versions
Hope this clarifies this weird behavior of the UI for some.
Virtual Datacenter scaling problems with traditional shared storage – part 2
Oversubscription Ratios
The most common virtual datacenter architecture consists of a group of ESXi hosts connected via a network to a centralized storage array. The storage area network design typically follows the core-to-edge topology. In this topology a few high-capacity core switches are placed in the middle this topology. ESXi hosts are sometimes connected directly to this core switch but usually to a switch at the edge. An inter-switch link connects the edge switch to the core switch. Same design applies to the storage array; it’s either connected directly to the core switch or to an edge switch.
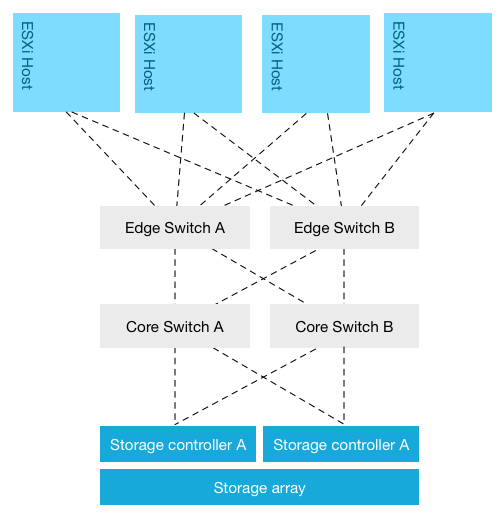
This network topology allows scaling out easily from a network perspective. Edge switches (sometimes called distribution switches) are used to extend the port count. Although core switches are beefy, there is however a limitation on the number of ports. And each layer in the network topology has its inherent roles in the design. One of the drawbacks is that Edge-to-Core topologies introduce oversubscription ratios, where a number of edge ports use a single connection to connect to a core port. Placement of systems begins to matter in this design as multiple hops increase latency.
To reduce latency the number of hops should be reduced, but this impacts port count (and thus number of connected hosts) which impacts bandwidth availability, as there are a finite amounts of ports per switch. Adding switches to increase port count brings you back to device placement problems again. As latency play a key role in application performance, most storage area network aim to be as flat as possible. Some use a single switch layer to connect the host layer to the storage layer. Let’s take a closer look on how scale out compute and this network topology impacts storage performance:
Storage Area Network topology
This architecture starts of with two hosts, connected with 2 x 10GB to a storage array that can deliver 33K IOPS. The storage area network is 10GB and each storage controller has two 10GB ports. To reduce latency as much as possible, a single redundant switch layer is used that connects the ESXi hosts to the storage controller ports. It looks like this:
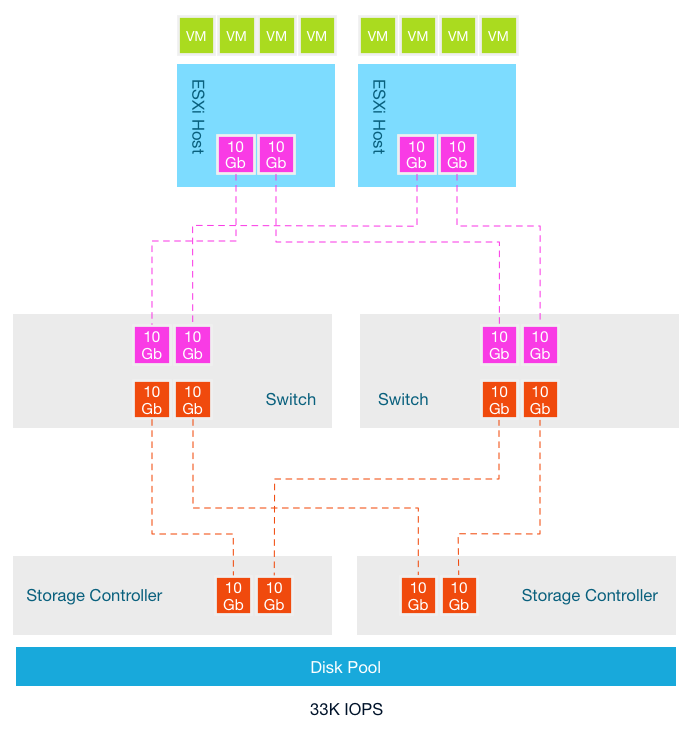
In this scenario the oversubscription ratio of links between the switch and the storage controller is 1:1. The ratio of consumer network connectivity to resource network connectivity is equal. New workload is introduced which requires more compute resources. The storage team increases the spindle count to increase more capacity and performance at the storage array level.

Although both the compute resources and the storage resources are increased, no additional links between the storage controllers are added. The oversubscription ratio is increased and now a single 10Gb link of an ESXi host has to share this link with potentially 5 other hosts. The answer is obviously increasing the number of links between the switch and the storage controllers. However most storage controllers don’t allow scaling the network ports. This design stems from the era where storage arrays where connected to a small number of hosts running a single application. On top of that, it took the non-concurrent activity into account. Not every application is active at the same time and with the same intensity.
The premise of grouping intermitted workloads led to virtualization, allowing multiple applications using powerful server hardware. Consolidation ratios are ever expanding, normalizing intermittent workload into a steady stream of I/O operations. Workloads have changed, more and more data is processed every day, pushing these IO’s of all these applications through a single pipe. Bandwidth requirements are shooting through the roof, however many storage area network designs are based of best practices prior to the virtualization era. And although many vendors stress to aim for a low oversubscription ratio, the limitation of storage controller ports prevents removing this constraint.
In the scenario above I only used 6 ESXi hosts, typically you will see a lot more ESXi hosts connected to the same-shared storage array, stressing the oversubscription ratio. In essence you have too squeeze more IO through a smaller funnel, this will impact latency and bandwidth performance.
Frequently scale-out problems with traditional storage architecture are explained by calculating the average number of IOPS per host by dividing the number of host by the total number of IOPS provided by the array. In my scenario, the average number of IOPS is 16.5K IOPS remained the same due to the expansion of storage resources at the same time the compute resources were added (33/2 or 100/6). Due to the way storage is procured (mentioned in part 1) storage arrays are configured for expected peak performance at the end of its life cycle.
When the first hosts are connected, bandwidth and performance are (hopefully) not a problem. New workloads lead to higher consolidation ratio’s, which typically result in expansion of compute cycles to keep the consolidation ratio at a certain level to satisfy performance and availability requirements. This generally leads to reduction of bandwidth and IOPS per hosts. Arguably this should not pose a problem if sizing was done correctly. Problem is, workload increase and workload behavior typically do not align with expectations, catching the architects off-guard or simply new application landscape turn up unexpectedly when business needs change. A lack of proper analytics impacts consumption of the storage resources and avoiding hitting limits. It’s not unusually for organizations to experience performance problems due to lack of proper visibility in workload behavior. To counteract this, more capacity is added to the storage array to satisfy capacity and performance requirements. However this does not solve the problem that exists right in the middle of these two layers. It ignores the funnel created by the oversubscription ratio of the links connected to the storage controller ports.
The storage controller port count impact the ability to solve this problem, another problem is that the way total bandwidth is consumed. The activity of the applications and the distribution of the virtual machines across the compute layer affect the storage performance, as workload might not be distributed equally across the links to the storage controllers. Part 3 of this series will focus on this problem.