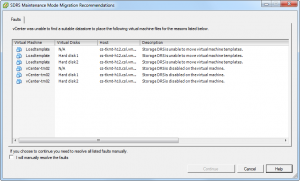
Please note that Storage DRS cannot move VM templates via storage vMotion. This can impact load balancing operations or datastore maintenance mode operations. When initiating Datastore Maintenance mode, the following message is displayed:

As maintenance mode is commonly used for array migrations of datastore upgrade operations (VMFS-3 to VMFS-5), remember to convert the VM template to a virtual machine first before initiating maintenance mode.
My public VMworld schedule
This year will be an action-packed VMWorld for me, presenting sessions, participating in two panel sessions, hosting a group discussion and available in two “Meet the expert” sessions.
Presenting the following sessions:
INF-STO1545 – Architecting Storage DRS Datastore Clusters
INF-VSP1683 – VMware vSphere Cluster Resource Pools Best Practices
Panel sessions:
(TAM Day) – ASK THE EXPERTS
INF-VSP1504 – Ask the Expert vBloggers
Hosting the GD22 – Resource management (DRS/SDRS) group discussion. I invited Anne Holler (Lead engineer DRS) to host this session together with me.
During Meet the Experts session 13 and session 17 I’m available for short meetings to answer your resource management (DRS\SDRS) questions.
Here is the week schedule of the sessions/events/activities that I will be taking part of, be sure to sign up if you have not already:
Sunday (TAM Day):
14:35 – 15:35 : ASK THE EXPERTS
Monday:
14:30 – 15:30 : INF-VSP1504 – Ask the Expert vBloggers
16:00 – 17:00 : GD22 – Resource Management
Tuesday:
12:30 – 13:30 : INF-STO1545 – Architecting Storage DRS Datastore Clusters (Repeat session)
15:00 – 16:00 : INF-VSP1683 – vSphere Cluster Resource Pools Best Practices
Wednesday:
08:30 – 09:30 : INF-STO1545 – Architecting Storage DRS Datastore Clusters
12:30 – 13:30 : Expert 13
Thursday:
12:00 – 12:00 : Expert 17
DRS and memory balancing in non-overcomitted clusters
First things first, I normally do not recommend changing advanced settings. Always try to tune system behavior by changing the settings provided by the user interface or try to understand system behavior and how it aligns with your design.
The “problem”
DRS load balancing recommendations could be sub-optimal when no memory overcommitment is preferred.
Some customers prefer not to use memory overcommitment. The clusters contain (just) enough memory capacity to ensure all running virtual machines have their memory backed by physical memory. Nowadays it is not uncommon seeing virtual machines with fairly highly allocated (consumed) memory and due to the use of large pages on hosts with recent CPU architectures, little to no memory is shared. Common scenario with this design is a usual host memory load of 80-85% consumed. In this situation, DRS recommendations may have a detrimental effect on performance as DRS does not consider consumed memory but active memory.
DRS behavior
When analyzing the requirements of a virtual machine during load balancing operations, DRS calculates the memory demand of the virtual machine.
The main memory metric used by DRS to determine the memory demand is memory active. The active memory represents the working set of the virtual machine, which signifies the number of active pages in RAM. By using the working-set estimation, the memory scheduler determines which of the allocated memory pages are actively used by the virtual machine and which allocated pages are idle. To accommodate a sudden rapid increase of the working set, 25% of idle consumed memory is allowed. Memory demand also includes the virtual machine’s memory overhead.
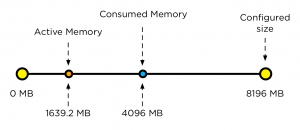
Let’s use an 8 GB virtual machine as example on how DRS calculates the memory demand. The guest OS running in this virtual machine has touched 50% of its memory size since it was booted but only 20% of its memory size is active. This means that the virtual machine has consumed 4096 MB and 1639.2 MB is active.

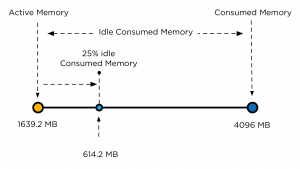
As mentioned, DRS accommodate a percentage of the idle consumed memory to accommodate a sudden increase of memory use. To calculate the idle consumed memory, the active memory 1639.2 MB is subtracted from the consumed memory, 4096 MB, resulting in a total 2456.8 MB. By default DRS includes 25% of the idle consumed memory, i.e. 614.2 MB.

The virtual machine has a memory overhead of 90 MB. The memory demand DRS uses in it’s load balancing calculation is as follows: 1639.2 MB + 614.2 MB + 90 MB = 2343.4 MB. This means that DRS will select a host that has 2343.4 MB available for this machine and the move to this host improves the load balance of the cluster.
DRS and corner stone of virtualization resource overcommitment
Resource sharing and overcommitment of resources are primary elements of the virtualization. When designing virtual infrastructure it is a challenge to build the environment in such a way that it can handle virtual machine workloads while improving server utilization. Because every workload is not equal, applying resource allocation settings such as shares, reservations and limits can make distinction in priority.
DRS is designed with this corner stone in mind. And that’s makes DRS sometimes a hard act to follow. DRS is all about solving imbalance and providing enough resources to the virtual machines aligned to their demand. This means that DRS balances workload on demand and trust in its core value that overcommitment is allowed. It then relies on the host local scheduler to figure out the priority of the virtual machines. And this behavior is sometimes not in line with the perception of DRS.
A common perception is that DRS is about optimizing performance. This is partially true. As mentioned before DRS looks at the demand of the VM, and will try to mix and match activity of the virtual machines with the available resources in the cluster. As it relies on resource allocation settings, it assumes that priority is defined for each virtual machine and that the host local schedulers can reclaim memory safely. For this reason the DRS memory imbalance metric is tuned to focus on VM active memory to allow efficient sharing of host memory resources. Allowing to run with less cluster memory than the sum of all running virtual machine memory sizes and reclaiming idle consumed memory from lower priority virtual machines for other virtual machines’ active workloads.
Unfortunately DRS does not know when the environment is designed in such a way to avoid overcommitment. Based on the input it can place a virtual machine on a host with virtual machine that have lots of idle consumed memory laying around. Instigating memory reclamation. In most cases this reclamation is hardly noticeable due to the use of the balloon driver. However in the case where all hosts are highly utilized, ballooning might not be as responsive as required, forcing the kernel to compress memory and swap. This means that migrations for the sole purpose of balancing active memory are not useful in environments like these and, if the target host memory is highly consumed, can cause a performance impact on the migrating virtual machine as it waits to obtain memory and on the other virtual machines on the target host as they do processing to allow reclamation of their idle memory.
The solution? You might want to change the 25% idle consumed memory setting
The solution I recommend to start with is to lower the migration threshold by moving the slider to the left. This allows the DRS cluster to have an higher imbalance and allows DRS to be more conservative when recommending migrations.
If this is not satisfactory, then I would suggest changing the DRS advanced option called IdleTax. Please note that this DRS advanced option is not the same setting as the memory kernel setting. Mem.IdleTax.
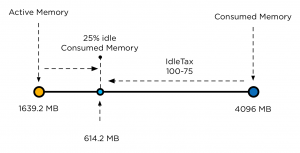
The DRS IdleTax advanced option (default 75) controls how much consumed idle memory should be added to active memory in estimating memory demand. The calculation is as follows: 100-IdleTax. Default caluculation = 100-75=25
This means that the smaller the value of IdleTax, more consumed idle memory is added to the active memory by DRS for load balancing.

Be aware that the value of IdleTax is a heuristic, tuned to facilitate memory overcommitment; tuning it to a lower value is appropriate for environments not using overcommitment. Note that the option is set per cluster, and would need to be changed for all DRS clusters as appropriate.
Again, try to use a lower migration threshold setting and monitor if this setting provides satisfying results before setting this advanced feature.
Storage DRS enables SIOC on datastores only if I/O load balancing is enabled
Lately, I’ve received some comments why I don’t include SIOC in my articles when talking about space load balancing. Well, Storage DRS only enables SIOC on each datastore inside the datastore cluster if I/O load balancing is enabled. When you don’t enable I/O load balancing during the initial setup of the datastore cluster, SIOC is left disabled.
Keep in mind when I/O load balancing is enabled on the datastore cluster and you disable the I/O load balancing feature, SIOC remains enabled on all datastores within the cluster.
Considerations when modifying the individual VM automation level
Recently I received some questions about the behavior of DRS when the automation level of an individual virtual machine is modified. DRS allows customization of the automation levels for individual virtual machines to override the DRS cluster automation level. The most common reason for modifying the automation level is to prevent DRS move a virtual machine automatically. Selecting an automation level mode other than the default cluster automation level or fully automated impacts (daily) operational procedures. It might impact cluster balance and/or resource availability if the operational procedures are not adjusted to align with the “new” behavior of DRS when dealing with non-default automation levels. Before continuing with the impact and caveats of a non-default automation level, let’s zoom into their behavior.
Level of automation
There are five automation level modes:
• Fully Automated
• Partially Automated
• Manual
• Default
• Disabled
Each automation level behaves differently:
| Automation level | Initial placement | Load Balancing |
| Fully Automated | Automatic Placement | Automatic execution of migration recommendation |
| Partially Automated | Automatic Placement | Migration recommendation is displayed |
| Manual | Recommended host is displayed | Migration recommendation is displayed |
| Disabled | VM powered-on on registered host | No migration recommendation generated |
The default automation level is not listed in the table above as it aligns with the cluster automation level. When the automation level of the cluster is modified, the individual automation level is modified as well.
Disabled automation level
If the automation level of a virtual machine is set to disabled, then DRS is disabled entirely for the virtual machine. DRS will not generate a migration recommendation or generate an initial placement recommendation. The virtual machine will be powered-on on its registered host. A powered-on virtual machine with its automation level set to disabled will still impact the DRS load balancing calculation as its consumes cluster resources. During the recommendation calculation, DRS ignores the virtual machines set to disabled automation level and selects other virtual machines on that host. If DRS must choose between virtual machines set to the automatic automation levels and the manual automation level, DRS chooses the virtual machines set to automatic as it prefers them over virtual machines set to manual.
Manual automation level
When a virtual machine is configured with the manual automation level, DRS generate both initial placement and load balancing migration recommendations, however the user needs to manual approve these recommendations.
Partially automation level
DRS automatically places a virtual machine with a partially automation level, however it will generate a migration recommendation which requires manual approval.
The impact of manual and partially automation level on cluster load balance
When selecting any other automation level than disabled, DRS assumes that the user will manual apply the migration recommendation it recommends. This means that DRS will continue to include the virtual machines in the analysis of cluster balance and resource utilization. During the analysis DRS simulates virtual machine moves inside the cluster, every virtual machine that is not disabled will be included in the selection process of migration recommendations. If a particular move of a virtual machine offers the highest benefit and the least amount of cost and lowest risk, DRS generates a migration recommendation for this move. Because DRS is limited to a specific number of migrations, it might drop a recommendation of a virtual machine that provide almost similar goodness. Now the problem with this scenario is, that the recommended migration might be a virtual machine configured with a manual automation level, while the virtual machine with near-level goodness is configured with the default automation level. This should not matter if the user monitors each and every DRS invocation and reviews the migration recommendations when issued. This is unrealistic to expect as DRS runs each 5 minutes.
I’ve seen a scenario where a group of the virtual machines where configured with manual mode. It resulted in a host becoming a “trap” for the virtual machines during an overcommitted state. The user did not monitor the DRS tab in vCenter and was missing the migration recommendations. This resulted in resource starvation for the virtual machines itself but even worse, it impacted multiple virtual machines inside the cluster. Because DRS generated migration recommendations, it dropped other suitable moves and could not achieve an optimal balance.
For more information about the maximum number of moves, please read this article. Interested in more information about goodness values, please read this article.
Disabled versus partially and manual automatic levels
Disabling DRS on a virtual machines have some negative impact on other operation processes or resource availability, such as placing a host into maintenance mode or powering up a virtual machine after maintenance itself. As it selects the registered host, it might be possible that the virtual machine is powered on a host with ample available resources while more suitable hosts are available. However disabled automation level avoids the scenario described in the previous paragraph.
Partially automatic level automatically places the virtual machine on the most suitable host, while manual mode recommends placing the host on the most suitable host available. Partially automated offers the least operational overhead during placement, but can together with manual automation level introduce lots of overhead during normal operations.
Risk versus reward
Selecting an automation level is almost a risk versus reward game. Setting the automation level to disabled might impact some operation procedures, but allows DRS to neglect the virtual machines when generating migration recommendations and come up with alternative solutions that provide cluster balance as well. Setting the automation level to partially or manual will offer you better initial placement recommendations and a more simplified maintenance mode process, but will create the risk of unbalance or resource starvation when the DRS tab in vCenter is left unmonitored.