• Skip to primary navigation
  • Skip to main content

frankdenneman.nl

  • AI/ML
  • NUMA
  • About Me
  • Privacy Policy

Ballooning, Queue Depths and other back pressure features revisited

May 20, 2015 by frankdenneman

Recently I’ve been involved in a couple conversations about ballooning, QoS and queue depths. Remarks like ballooning is bad, increase the queue depths and use QoS are just the sound bits that spark the conversation. What I learn from these conversations is that it seems we might have lost track of the original intention of these features.
Hypervisor resource management
Features such as ballooning and queue depths are invented to solve the gap between resource demand and resource availability. When a system experiences a state where resource demand exceeds the resources it controls the system has a problem. This is especially true in systems such as a hypervisor where you cannot control the demand directly. A guest operating system or an application in a virtual machine can demand a lot of resources. The resource management schedulers inside the hypervisor are tasked to fulfilling the demand of that particular machine while at the same time satisfy the resource demand of other virtual machines. Typically the guest OS resource schedulers are not integrated with the hypervisor resource schedulers, this can lead to a situation in which the administrator typically resorts to taking draconian measures. Measures such as disabling ballooning, increasing the queue-depth to become the digital equivalent of the Mariana trench.
Sometimes it is taken for granted, but resource management inside the hypervisor is actually a though challenge to solve. Much research is done on solving this problem; a lot of research papers trying to find an answer to this challenge are published on a monthly basis. Let’s step back and take a look from an engineer perspective (or should I say developer?) and see what the problem is and how to solve it in the most elegant way. It’s an architect job to understand that this functionality is not a replacement for a proper design. Let’s start by understanding the problem.
Load-shedding or back pressure
When dealing with the situation where resource demand exceeds resource availability you can do two things. Well if you don’t do anything, it’s likely to encounter a system failure that can affect a lot more than only that particular resource or virtual machines. Overall you don’t design for system failure, you want to avoid it and to do so you can either drop the load or apply some form of back pressure. I think we all agree that dropping load, sometimes referred to as load-shedding is not the most elegant way of dealing with temporary overload, that’s why a lot of effort is going into back pressure features.
A back pressure feature that everyone is familiar with is the memory balloon driver. Guest OS memory schedulers deal with used and free memory in such a way that this is transparent to the hypervisor. When the hypervisor is running out of physical machine memory it needs to figure out a way to retrieve memory. By using the balloon driver, the hypervisor asks the guest OS memory scheduler to provide a list of pages that it doesn’t use or doesn’t deem as important. After getting the info, the hypervisor proceeds to free up the physical memory pages to be able to satisfy incoming memory requests. Instead of dropping the new incoming workload it applies a back pressure system in the most elegant way. I don’t know why people are still talking about ballooning as bad. The feature is awesome, it’s the architect / sys admin job to come up with a plan to avoid back pressure in the system. Again the back pressure feature is not substitute for proper design and management.
But the most misunderstood back pressure feature could be queue-depths. Sometimes I hear people refer to queue depths as a performance enhancement. And this is not true. It just allows you to temporarily deal with I/O overload. The best way to have a clear understanding of queue depths is to use the bathroom sink analogy.
The drain is the equivalent of the data path leading to the storage array, the sink itself is the queue sitting on top of the data path / drain. The faucet represents the virtual machine workloads. Typically you open up the faucet to a level that allows the drain to cope with the flow of water. Same applies to virtual machine workloads and the underlying storage system. You run an x amount of workload that is suitable for your storage system. The moment you open up the faucet more your sink will fill up and at one point your sink will overflow. Thus you have to do some back pressure mechanism. In the bathroom sink world this typically is done by flowing the water back into the second sink. In the I/O scheduler world this typically resolves in a queue full statement. This typically bogs down the performance of the virtual machine so much that many admins/architect resolve by increasing the queue depth. Because this allows them to avoid the queue full state (temporarily) But in essence you just replaced your bathroom sink by a bigger sink, or something when people go overboard the increase the queue depth to the digital equivalent of a full size bathtub. This bathtub impacts a lot of other workloads as many workload now end up at the top of the queue instead of the deeper part, waiting their turn to go through the drain to the storage system. Result: latency increases in all applications due to improper designed systems. And remember when the bathtub overflows you typically have a bigger mess to deal with.
Back pressure features are not a substitute for proper design, therefor think about implementing a bigger drain of even better multiple drains. More bandwidth or just more data paths to the same storage system lead to a short delay of seeing the same back pressure problem again, it just occurs on a different level. Typically when a storage controller fills up its cache, it sends a queue full to all the connected systems, so the problem has now evolved from a system wide problem to a cluster wide problem. This is one of the big reasons why scale out storage systems are a great fit in the virtual datacenter. You create drains to different sewer system typically in a more plan-able manner. If you are looking for more information about this topic, I published a short series on the challenge of traditional storage architectures in virtual datacenters.
Quality of Service faces the same predicament. QoS is a great feature dealing with temporary overload, but again, it is not a substitute for a proper design. Back pressure features are great, it allows the system to deal with resource contentions while avoiding system failures. These features are unmissable in the dynamic virtual datacenter of today. When detecting that these features are activated on a frequent basis, one must review the virtual datacenter architecture, the current workloads and future workloads.
I think overall it all boils down to understand the workload in your system and have an accurate view of the capabilities of your systems. Proper monitoring and analytics tools are therefore indispensable. Not only for daily operations but also for architects dealing with maintaining a proper service level for their current workloads while architecting an environment that can deal with unknown future workloads.

Filed Under: VMware

VMware Tools is out of date on this virtual machine while summary states Current

May 5, 2015 by frankdenneman

For some apparent reason all my virtual machines show an alert that the VMware tools is out of date. While the summary states that its running the current version
VMware Tools is out of data on this virtual machine while summary states Current
When trying to upgrade the VMware tools, all options are grayed out:
Grayed out VMtools options
It appears to be a cosmetic error but I stil wanted to know why it shows the alert on my virtual machines.
As it turns out I created my templates on my management cluster host (lab) and that host runs a newer version of vSphere 5.5 (2068190)
Management cluster version
My workload cluster host run a slightly older version of vSphere 5.5 and it uses a different version of VMtools.
Workload cluster version
The VMtools version list helps you to identify which version of VMtools installed in your virtual machine belongs to which ESXi version: https://packages.vmware.com/tools/versions
Hope this clarifies this weird behavior of the UI for some.

Filed Under: VMware

Virtual Datacenter scaling problems with traditional shared storage – part 2

March 12, 2015 by frankdenneman

Oversubscription Ratios
The most common virtual datacenter architecture consists of a group of ESXi hosts connected via a network to a centralized storage array. The storage area network design typically follows the core-to-edge topology. In this topology a few high-capacity core switches are placed in the middle this topology. ESXi hosts are sometimes connected directly to this core switch but usually to a switch at the edge. An inter-switch link connects the edge switch to the core switch. Same design applies to the storage array; it’s either connected directly to the core switch or to an edge switch.
Part-2-01-core-edge-switch
This network topology allows scaling out easily from a network perspective. Edge switches (sometimes called distribution switches) are used to extend the port count. Although core switches are beefy, there is however a limitation on the number of ports. And each layer in the network topology has its inherent roles in the design. One of the drawbacks is that Edge-to-Core topologies introduce oversubscription ratios, where a number of edge ports use a single connection to connect to a core port. Placement of systems begins to matter in this design as multiple hops increase latency.
To reduce latency the number of hops should be reduced, but this impacts port count (and thus number of connected hosts) which impacts bandwidth availability, as there are a finite amounts of ports per switch. Adding switches to increase port count brings you back to device placement problems again. As latency play a key role in application performance, most storage area network aim to be as flat as possible. Some use a single switch layer to connect the host layer to the storage layer. Let’s take a closer look on how scale out compute and this network topology impacts storage performance:
Storage Area Network topology
This architecture starts of with two hosts, connected with 2 x 10GB to a storage array that can deliver 33K IOPS. The storage area network is 10GB and each storage controller has two 10GB ports. To reduce latency as much as possible, a single redundant switch layer is used that connects the ESXi hosts to the storage controller ports. It looks like this:
01-two host architecture
In this scenario the oversubscription ratio of links between the switch and the storage controller is 1:1. The ratio of consumer network connectivity to resource network connectivity is equal. New workload is introduced which requires more compute resources. The storage team increases the spindle count to increase more capacity and performance at the storage array level.
02-six host architecture
Although both the compute resources and the storage resources are increased, no additional links between the storage controllers are added. The oversubscription ratio is increased and now a single 10Gb link of an ESXi host has to share this link with potentially 5 other hosts. The answer is obviously increasing the number of links between the switch and the storage controllers. However most storage controllers don’t allow scaling the network ports. This design stems from the era where storage arrays where connected to a small number of hosts running a single application. On top of that, it took the non-concurrent activity into account. Not every application is active at the same time and with the same intensity.
The premise of grouping intermitted workloads led to virtualization, allowing multiple applications using powerful server hardware. Consolidation ratios are ever expanding, normalizing intermittent workload into a steady stream of I/O operations. Workloads have changed, more and more data is processed every day, pushing these IO’s of all these applications through a single pipe. Bandwidth requirements are shooting through the roof, however many storage area network designs are based of best practices prior to the virtualization era. And although many vendors stress to aim for a low oversubscription ratio, the limitation of storage controller ports prevents removing this constraint.
In the scenario above I only used 6 ESXi hosts, typically you will see a lot more ESXi hosts connected to the same-shared storage array, stressing the oversubscription ratio. In essence you have too squeeze more IO through a smaller funnel, this will impact latency and bandwidth performance.
Frequently scale-out problems with traditional storage architecture are explained by calculating the average number of IOPS per host by dividing the number of host by the total number of IOPS provided by the array. In my scenario, the average number of IOPS is 16.5K IOPS remained the same due to the expansion of storage resources at the same time the compute resources were added (33/2 or 100/6). Due to the way storage is procured (mentioned in part 1) storage arrays are configured for expected peak performance at the end of its life cycle.
When the first hosts are connected, bandwidth and performance are (hopefully) not a problem. New workloads lead to higher consolidation ratio’s, which typically result in expansion of compute cycles to keep the consolidation ratio at a certain level to satisfy performance and availability requirements. This generally leads to reduction of bandwidth and IOPS per hosts. Arguably this should not pose a problem if sizing was done correctly. Problem is, workload increase and workload behavior typically do not align with expectations, catching the architects off-guard or simply new application landscape turn up unexpectedly when business needs change. A lack of proper analytics impacts consumption of the storage resources and avoiding hitting limits. It’s not unusually for organizations to experience performance problems due to lack of proper visibility in workload behavior. To counteract this, more capacity is added to the storage array to satisfy capacity and performance requirements. However this does not solve the problem that exists right in the middle of these two layers. It ignores the funnel created by the oversubscription ratio of the links connected to the storage controller ports.
The storage controller port count impact the ability to solve this problem, another problem is that the way total bandwidth is consumed. The activity of the applications and the distribution of the virtual machines across the compute layer affect the storage performance, as workload might not be distributed equally across the links to the storage controllers. Part 3 of this series will focus on this problem.

Filed Under: VMware

New TPS management capabilities

February 2, 2015 by frankdenneman

Recently VMware decided that it’s best to change Transparent Page Sharing (TPS) behavior. In KB 2080735 they state the following:

Although VMware believes the risk of TPS being used to gather sensitive information is low, we strive to ensure that products ship with default settings that are as secure as possible. For this reason new TPS management options are being introduced and inter-Virtual Machine TPS will no longer be enabled by default in ESXi 5.5, 5.1, 5.0 Updates and the next major ESXi release. Administrators may revert to the previous behavior if they so wish.

VMware reworked the TPS code and the new code is included in version: ESXi 5.5 Update 2d (Q1, 2015), ESXi 5.1 Update 3 (12/4, 2014) and ESXi 5.0 Update 3d (Q1, 2015).
In the previous released patches*, new TPS management capabilities where introduced but not enabled by default. The new TPS management capabilities introduce the concept of salting has been introduced to control Intra-VM TPS.
What is salting?
This whole exercise of protecting TPS started when researchers found a way to determine the AES encryption key in use of virtual machines on a physical processor (grossly simplified explanation). To counter act this, VMware added salting options to harden TPS. In encryption salting is the act of adding random data to make a common password uncommon. By concatenating random data to a common password, the password now becomes uncommon, making it unlikely to show up in any common password list. This slows down the attack. Martin Suecia provided a more elaborate, but easy to understand, explanation about salting on crypto.stackexchange.com.
VMware adopted this concept to group virtual machines. If they contain the same random number they are perceived to be trustworthy and can share pages. If the random number doesn’t match, no memory page sharing occurs between the virtual machines. By default the vc.uuid of the virtual machine is used as random number. And because the vc.uuid is unique randomly generated string for a virtual machine in a Virtual Center, it will never be able to share pages with other virtual machines.
Lets rehash TPS, as there seems to be some misconception on how TPS works. TPS by itself is a two-tier process.
Two tier process
There is an act of identifying identical pages and there is an act of sharing (collapsing) identical pages. TPS cannot collapse pages immediately when starting a virtual machine. TPS is a process in the VMkernel; it runs in the background and searches for redundant pages. Default TPS will have a cycle of 60 minutes (Mem.ShareScanTime) to scan a VM for page sharing opportunities. The speed of TPS mostly depends on the load and specs of the Server. Default TPS will scan 4MB/sec per 1 GHz. (Mem.ShareScanGHz). Slow CPU equals slow TPS process. (But it’s not a secret that a slow CPU will offer less performance that a fast CPU.) TPS defaults can be altered, but it is advised to keep to the default. VMware optimized memory management in ESX 4 that allow pages which Windows initially zeroes will be page-shared by TPS immediately. Please not that this is based on best effort basis this to avoid creating massive overhead on trying to scan in-line.
TPS and large pages
One caveat, TPS will not collapse large pages when the ESX server is not under memory pressure. ESX will back large pages with machine memory, but installs page sharing hints. When memory pressure occurs, the large page will be broken down and TPS can do it’s magic. For more info: Future direction of disabling TPS by default and its impact on capacity planning.
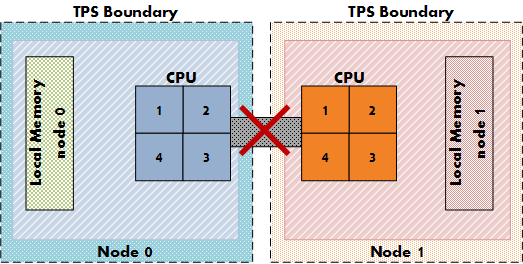
TPS and CPU NUMA structures
Another impact on the memory sharing potential is the NUMA processor architecture. NUMA allows the best memory performance by storing memory pages as close to a CPU as possible. TPS memory sharing could reduce the performance while pages are shared between two separate CPU systems. For more info about NUMA and TPS please read the article: “Sizing VMS and NUMA nodes”
NUMA-TPS
Intra-VM and Inter-VM
When TPS identifies a common page it will collapse it, common pages occur within the memory footprint of a virtual machine itself (Intra-VM) and between virtual machines (Inter-VM). The new setting allows for TPS to collapse page within the memory footprint of the virtual machine itself, but not between virtual machines! Be aware that Intra-VM sharing only occurs today within a NUMA node, with small pages or when large pages are torn down.
TPS salting
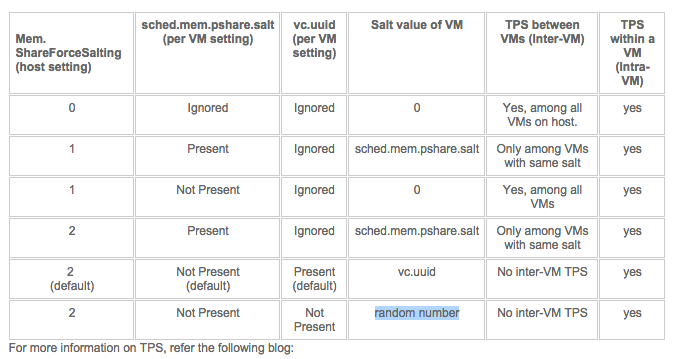
In order to Salt pages, two settings must be activated, one at the host (VMkernel) level and one at the virtual machine level. The VMkernel setting is Mem.ShareForceSalting and in the upcoming update releases it is set to “2”. Why not use the setting “1” you might ask? By reviewing the various KB articles, it seems that VMware extending the current salting options introduced in update releases: ({5.5,5.1}201410401 and 5.0 201412401) (KB: 2091682)
KB article 2097593 provides us with the following table:
TPS Management settings
Re-enable Intra-VM TPS
That means that if you want to re-enable Intra-VM TPS you have two options. In-line with security guidelines or reverting back to traditional TPS behavior.
1: To be in-line with the security guidelines you have to set Mem.ShareForceSalting to 1 or 2 and for the virtual machines you wish to share, set sched.mem.pshare.salt to a common value. (Bottom row in the table)
2: To revert back to the traditional TPS behavior you have to set Mem.ShareForceSalting to 0.
For the changes to take effect do either of the two:
1. Migrate all the virtual machines to another host in cluster and then back to original host.
2. Shutdown and power-on the virtual machines.
Since its normal to place host in maintenance mode before changing its configuration, option 1 seems like the most common operation. Put a host into maintenance mode, let DRS migrate all the virtual machines to another host, change the setting and exit maintenance mode. Rinse and repeat for all hosts in the cluster.
Recommendations whether to use salting?
Honestly I don’t have any. Security is something that shouldn’t be taken lightly. VMware implies that this security measure is somewhat excessive. Therefor it depends on your security guidelines and your service offering (Public cloud versus own infrastructure) whether you should go through the extra length of securing TPS or not.
Would I recommend enabling TPS? Of course! It’s one of the most intelligent features of the vSphere stack. Allowing you to use the available resources as efficiently as possible.
By default salting is disabled (Mem.ShareForceSalting=0). This means TPS happens as it used to before this patch, that is, all the Virtual Machines on an ESXi box participate in TPS.
* Previous released patches
VMware ESXi 5.5, Patch ESXi550-201410401
VMware ESXi 5.1, Patch ESXi510-201410401
VMware ESXi 5.0, Patch ESXi500-201412401

Filed Under: VMware

99 cents Promo to celebrate a major milestone of the vSphere Clustering Deepdive series

October 9, 2014 by frankdenneman

This week Duncan was looking at the sales numbers of the vSphere Clustering Deep Dive series and he noticed that we hit a major milestone in September. In September 2014 we passed the 45000 copies distributed of the vSphere Clustering Deep Dive. Duncan and I never ever expected this or even dared to dream to hit this milestone.
vSphere-clustering-booksWhen we first started writing the 4.1 book we had discussions around what to expect from a sales point of view and we placed a bet, I was happy if we sold 100 books, Duncan was more ambitious with 400 books. Needless to say we reset our expectations many times since then… We didn’t really follow it closely in the last 12-18 months, and as today we were discussing a potentially update of the book we figured it was time to look at the numbers again just to get an idea. 45000 copies distributed (ebook + printed) is just remarkable.
We’ve noticed that the ebook is still very popular, and decided to do a promo. As of Monday the 13th of October the 5.1 e-book will be available for only $ 0.99 for 72 hours, then after 72 hours the price will go up to $ 3.99 and then after 72 hours it will be back to the normal price. So make sure to get it while it is low priced!
Pick it up here on Amazon.com! The only other kindle store we could open the promotion up for was amazon.co.uk, so that is also an option!

Filed Under: VMware

  • « Go to Previous Page
  • Page 1
  • Interim pages omitted …
  • Page 14
  • Page 15
  • Page 16
  • Page 17
  • Page 18
  • Interim pages omitted …
  • Page 29
  • Go to Next Page »

Copyright © 2025 · SquareOne Theme on Genesis Framework · WordPress · Log in