This week the DRMdiagnose fling is published. Produced by the resource management team and just in case you are wondering, DRM stands for Distributed Resource Manager; the internal code for DRS. Download DRMdiagnose at the VMware fling site. Please note that this fling only works on vSphere 5.1 environments
Purpose of DRMdiagnose
This tool is created to understand the impact on the virtual machines own performance and the impact on other virtual machines in the cluster if the resource allocation settings of a virtual machine are changed. DRMdiagnose compares the current resource demand of the virtual machine and suggest changes to the resource allocation settings to achieve the appropriate performance. This tool can assist you to meet service level agreements by providing feedback on desired resource entitlement. Although you might know what performance you want for a virtual machine, you might not be aware of the impact or consequences an adjustments might have on other parts of the resource environment or cluster policies. DRMdiagnose provides recommendations that provides the meets the resource allocation requirement of the virtual machines with the least amount of impact. A DRMdiagnose recommendation could look like this:
Increase CPU size of VM Webserver by 1
Increase CPU shares of VM Webserver by 4000
Increase memory size of VM Database01 by 800 MB
Increase memory shares of VM Database01 by 2000
Decrease CPU reservation of RP Silver by 340 MHz
Decrease CPU reservation of VM AD01 by 214 MHz
Increase CPU reservation of VM Database01 by 1000 MHz
How does it work
DRMdiagnose reviews the DRS cluster snapshot. This snapshot contains the current cluster state and the resource demand of the virtual machines. The cluster snapshot is stored on the vCenter server. These snapshot files can be found:
- vCenter server appliance: /var/log/vmware/vpx/drmdump/clusterX/
- vCenter server Windows 2003: %ALLUSERSPROFILE%\Application Data\VMware\VMware VirtualCenter\Logs\drmdump\clusterX\
- vCenter server Windows 2008: %ALLUSERSPROFILE%\VMware\VMware VirtualCenter\Logs\drmdump\clusterX\
The fling can be run in three modes:
- Default: Given a link to a drmdump, it lists all the VMs in the cluster, and their current demands and entitlements.
- Guided: Given a link to a drmdump, and a target allocation for the VM, generates a set of recommendations to achieve it.
- Auto: Given a link to a drmdump, generates a recommendation to satisfy the demand of the most distressed VM (the VM for which the gap between demand and entitlement is the highest).
Two things to note:
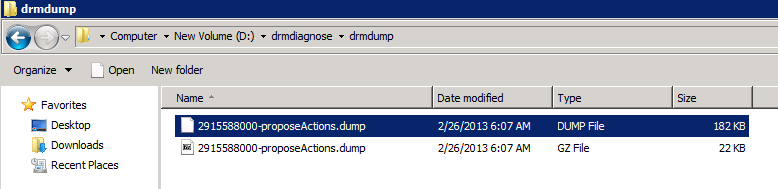
One: The fling does not have run on the vCenter server itself. Just install the fling on your local windows or linux system, copy over the latest drmdump file and run the fling. And second the drmdump file is zipped (GZ), unzip the file first to and run DRMdiagnose against the .dump file. A “normal” dumpfile should look like this:
How to run:
Open a command prompt in windows:
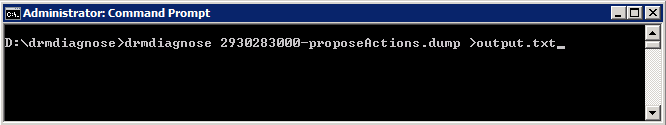
This command will provide the default output and provide you a list with CPU and Memory demand as well as entitlement. Instead of showing it on screen I chose to port it to a file as the output contains a lot of data.
A next article will expand on auto-mode and guided-mode use of DRMdiagnose. In the mean time, I would suggest to download DRMdiagnose and review your current environment.

Hi Frank, very nice fling! I was already working on a powershell script that retrive a top ten list of the vm with the greatest gap between the demand and the entitlement counter. Is it the right way to compute it ? Thanks.
Also of note, it only works on vSphere 5.1
Or using the capacity.contention counter since there is no demand counter for memory ?
Guess I’m ding someting wrong as it fails…
—— In-memory logs start ——–
mem> 2013-03-01T07:19:34.818Z [01392 info ‘Default’] Process attached
—— In-memory logs end ——–
2013-03-01T07:19:34.864Z [01392 info ‘Default’] Logging uses fast path: true
2013-03-01T07:19:34.864Z [01392 info ‘Default’] Handling bora/lib logs with VmaCore facilities
2013-03-01T07:19:34.864Z [01392 info ‘Default’] Initialized channel manager
2013-03-01T07:19:34.864Z [01392 info ‘Default’] Current working directory: C:\Us
ers\garybr\drmdiagnose
2013-03-01T07:19:34.864Z [01392 info ‘Default’] ThreadPool windowsStackImmediate
Commit = true
2013-03-01T07:19:34.864Z [01392 info ‘ThreadPool’] Thread enlisted
2013-03-01T07:19:34.864Z [01392 error ‘drmLogger’] Load snapshot: expecting version 116, got 71
–>
PANIC: ASSERT d:/build/ob/sb-1479871/bora/vpx/drs/algo/drmRebalanceModule.cpp:2748
What happens if you use an older dump file?
If you are using a storage DRS cluster in the environment, make sure you are selecting the dump files of the DRS cluster instead of the Storage DRS cluster:
DRS: 2930283000-proposeActions.dump
SDRS:3179820000-sioProposeActions.dump�
I think thats a version-thing, in our 5.0U2-environment it also doesn’t work. Is it really 5.1-only?
F:\Sourcen\Vmware\VMware-drmdiagnose-win32-5.1.0-1479871\drmdiagnose>drmdiagnose
.exe 2305556156-proposeActions.dump
—— In-memory logs start ——–
mem> 2013-03-01T10:11:02.019+01:00 [12680 info ‘Default’] Process attached
—— In-memory logs end ——–
2013-03-01T10:11:02.067+01:00 [12680 info ‘Default’] Logging uses fast path: tru
e
2013-03-01T10:11:02.067+01:00 [12680 info ‘Default’] Handling bora/lib logs with
VmaCore facilities
2013-03-01T10:11:02.068+01:00 [12680 info ‘Default’] Initialized channel manager
2013-03-01T10:11:02.068+01:00 [12680 info ‘Default’] Current working directory:
F:\Sourcen\Vmware\VMware-drmdiagnose-win32-5.1.0-1479871\drmdiagnose
2013-03-01T10:11:02.068+01:00 [12680 info ‘Default’] ThreadPool windowsStackImme
diateCommit = true
2013-03-01T10:11:02.069+01:00 [12680 info ‘ThreadPool’] Thread enlisted
2013-03-01T10:11:02.069+01:00 [12680 error ‘drmLogger’] Load snapshot: expecting
version 116, got 105
–>
PANIC: ASSERT d:/build/ob/sb-1479871/bora/vpx/drs/algo/drmRebalanceModule.cpp:27
48
2013-03-01T10:11:04.049+01:00 [12680 info ‘Default’] Process detached
2013-03-01T10:11:04.051+01:00 [12680 error ‘Default’] Alert:WARNING: This applic
ation is not using QuickExit(). The exit code will be set to 0.@ d:/build/ob/sb-
1479871/bora/vim/lib/vmacore/main/service.cpp:148
–> Backtrace:
–> backtrace[00] rip 100cf254
–> backtrace[01] rip 100d06f7
–> backtrace[02] rip 10078e67
–> backtrace[03] rip 1007a89d
–> backtrace[04] rip 10001366
–> backtrace[05] rip 100013e3
–> backtrace[06] rip 77549374
–> backtrace[07] rip 775385c2
–> backtrace[08] rip 775385e6
–> backtrace[09] rip 7757d884
–> backtrace[10] rip 7757da2b
When will the guided-mode article be out?
When I try to run the EXE the fling stops working and I get the following Error :
Problem Event Name: BEX
Application Name: drmdiagnose.exe
Application Version: 0.0.0.0
Application Timestamp: 50c03657
Fault Module Name: MSVCR90.dll
Fault Module Version: 9.0.30729.4926
Fault Module Timestamp: 4a1743c1
Exception Offset: 0002fef2
Exception Code: c0000417
Exception Data: 00000000
OS Version: 6.1.7600.2.0.0.272.7
Locale ID: 1033
Additional Information 1: a9d8
Additional Information 2: a9d8eeb3dc02e0a5c27916e9a8438c56
Additional Information 3: de3d
Additional Information 4: de3dafa612e61776a17c99d7ae09f9bd
Read our privacy statement online:
http://go.microsoft.com/fwlink/?linkid=104288&clcid=0x0409