• Skip to primary navigation
  • Skip to main content

frankdenneman.nl

  • AI/ML
  • NUMA
  • About Me
  • Privacy Policy

Home Lab Fundamentals: Time Sync

June 3, 2016 by frankdenneman

First rule of Home Lab club, don’t talk about time sync! Or so it seems. When starting your home lab, all hints and tips are welcome. The community is full of wisdom, however sometimes certain topics are taken for granted or are perceived as common knowledge. The Home Lab fundamentals series focusses on these subjects, helping you how to avoid the most common pitfalls that provide headaches and waste incredible amounts of time. A ‘time-consuming’ pitfall is dealing with improper time synchronization between the various components in your lab environment.
Most often, the need for time synchronization is seen as an Enterprise requirement but not really necessary for lab environments. Maybe because most think time synchronization is solely necessary for troubleshooting purposes. In some cases, this is true as ensuring correct time notation allows for proper correlation of events. Interestingly enough, this alone should be enough reason to maintain synchronized clocks throughout your lab, but most home labs are just rebuilt when troubleshooting becomes too time-consuming. However time sync is much more expedite troubleshooting and ignoring time drift is a straight path into the rabbit hole. Time synchronization utilities such as NTP are necessary to correct time drift introduced by hardware time drift and guest operating system timekeeping imprecision. When time differs between systems to much it can lead to installation and authentication errors. Unfortunately, time issues are not always easily identifiable, to provide a great example;

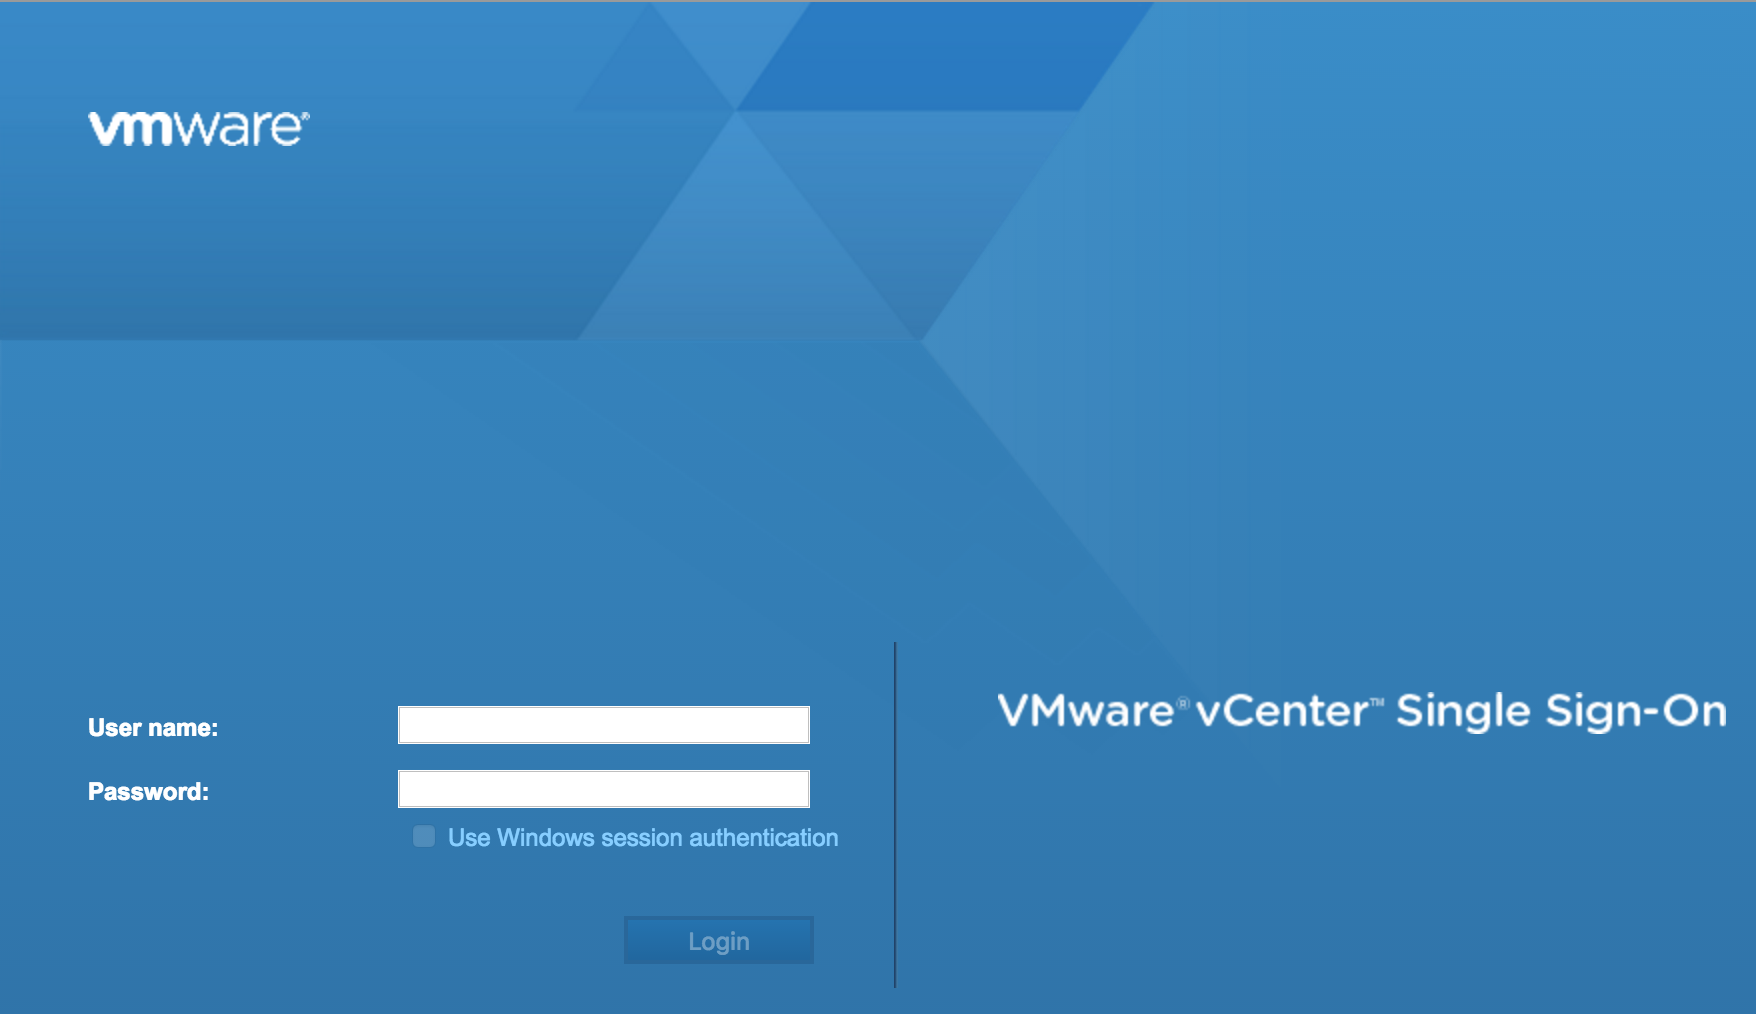
“[400] An error occurred while sending an authentication request to the vCenter Single Sign-On server – An error occurred when processing the metadata during vCenter Single Sign-On setup – null.”

This particular issue occurs due to a time skew between the vCenter Server Appliance 6.0 and the external Platform Service Controller. Here are just a few other examples of what can go wrong in your lab due to time skew issues;

  • Adding a host in vCenter Server fails with the error: Failed to configure the VIM account on the host (1029863) Time skew between ESXi host hardware clock and vCenter Server system time. https://kb.vmware.com/kb/1029863
  • After joining the Virtual Center Server Appliance to a domain you cannot see domain when adding user permissions (2011965): This issue occurs when the time skew between the Virtual Center Server Appliance(VCSA) and a related Domain Controller is greater than 5 minutes. https://kb.vmware.com/kb/2011965
  • Cluster level performance graphs show the most recent value as 0: This metric is susceptible to clock skew between the vSphere Client, vCenter Server, and ESX hosts. If any of the hosts have a skewed clock, the entire cluster shows as 0. https://kb.vmware.com/kb/2009550
  • The vCenter Server Appliance installation fails when connecting to an External Platform Services Controller: This issue occurs when the system time on the system hosting the PSC does not match the time of the system where vCenter Server is installed. https://kb.vmware.com/kb/2128811
  • Configuring the NSX SSO Lookup Service fails (2102041): Connectivity issues between the NSX Manager to vCenter Server due to time skew between NSX Manager and vCenter Server. https://kb.vmware.com/kb/2102041
  • Authentication Errors are Caused by Unsynchronized Clocks: If there is too great a time difference between the KDC and a client requesting tickets, the KDC cannot determine whether the request is legitimate or a replay. Therefore, it is vital that the time on all of the computers on a network be synchronized in order for Kerberos authentication to function properly. https://technet.microsoft.com/en-us/library/cc780011(v=ws.10).aspx

Timekeeping best practices by VMware
Simply put, when weird behavior during setup or authentication occurs, check the time between the various components first. VMware released multiple knowledge Base articles and technical documents that contain detailed information and instructions on timekeeping within the various components of the virtual datacenter:

  • Timekeeping in Vmware virtual Machines: http://www.vmware.com/files/pdf/Timekeeping-In-VirtualMachines.pdf
  • Timekeeping best practices for Windows, including NTP (1318): https://kb.vmware.com/kb/1318
  • Timekeeping best practices for Linux guests (1006427): https://kb.vmware.com/kb/1006427
  • ESX and ESXi host time keeping Best Practices: https://kb.vmware.com/kb/2004453

VMware doesn’t provide a separate time keeping best practices document for vCenter, but provides multiple guidelines in the vCenter Server Appliance configuration guide. When installing vCenter on a Windows machine it’s recommended to sync to the PDC emulator within the Active Directory domain. In general, VMware recommends to use native time synchronization software, such as Network Time Protocol (NTP) with the various vSphere components. NTP is typically more accurate than VMware Tools periodic time synchronization and is therefore preferred.
Time synchronization design
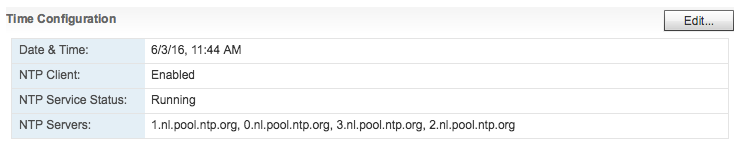
There are multiple schools of thoughts when it comes to time sync in a virtual data center. One of the most common ones is to synchronize the virtual datacenter infrastructure components such as ESXi hosts and the VCSA to a collection of external NTP server. Typically provided by http://www.pool.ntp.org/en/ or the US Naval observatory: http://tycho.usno.navy.mil/NTP/. Windows virtual machines sync their time to the Active Directory domain controller running the PDC emulator FSMO role: Time Synchronization in Active Directory Forests http://social.technet.microsoft.com/wiki/contents/articles/18573.time-synchronization-in-active-directory-forests.aspx It’s recommended to point the ESXi hosts to the same time source as the PDC emulator of the active directory. When running Linux best practice is to sync these systems with an NTP server.
Another widely adopted design is to sync ESX servers to the to the Active Directory domain controller running the PDC emulator FSMO role. VCSA time keeping configuration provide two valid options; NTP and hosts. In this scenario, select the host option to ensure time between the host and VCSA is in sync. If the VCSA is using a different time source other than the ESX host, a race condition can occur between time sync operations and can lead to failing the vpxd.
01-VMware vCenter Server 6.0 Update 2 Release Notes
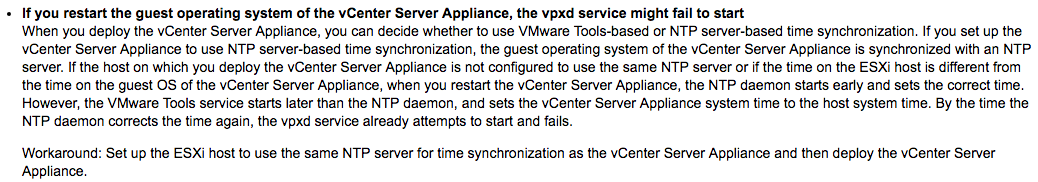
Source: VMware vCenter Server 6.0 Update 1b Release Notes: http://pubs.vmware.com/Release_Notes/en/vsphere/60/vsphere-vcenter-server-60u1b-release-notes.html
But the most interesting thing I witnessed that can easily become a wild-goose chase is the VM tools time synchronization when time on an ESXi host is incorrect. As described earlier, enabling VMware tools time sync on virtual machines was a best practice for a long time. Shifting towards native time synchronization software led VMware to disable the periodic time synchronization option by default. The keyword in the last sentence is PERIODIC. By default VMware tools synchronizes time with the host during the following options:

  • Resuming a suspended virtual machine
  • Migrating a virtual machine using vMotion
  • Taking a snapshot
  • Restoring a snapshot
  • Shrinking the virtual disk
  • Restarting the VMware tools service inside the VM
  • Rebooting the virtual machine

The time synchronization checkbox controls only whether time is periodically resynchronized while the virtual machine is running. Even if this box is unselected, by default VMware Tools synchronizes the virtual machine’s time to the ESXi host clock after the listed events. If the ESXi host time is incorrect it is likely that “unexplainable” errors will occur. I experienced this behavior after migrating a VM with vMotion. I couldn’t log on to a windows server as the time skew prevented me from authenticating.
You can either disable these options by adding rules to the VMX file of each VM or just ensure that the ESXi host is syncing the time with a proper external time source. For more information: Disabling Time Synchronization (1189) https://kb.vmware.com/kb/1189.
No time zone for ESXi
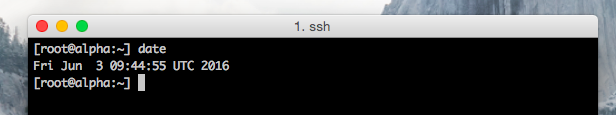
Be aware that as of vSphere 4.1 ESXi hosts are set to Universal Time Coordinated (UTC) time. UTC is interesting as its the successor of Greenwich Mean Time (GMT) but UTC itself is not a time zone, but a time standard. There are plenty of articles about UTC, but the key thing to understand is that it never observes Daylight Saving Time. As UTC is not a time zone, you cannot change the time notation in ESXi itself. The vSphere client, web client and HTML5 client automatically display the time in your local time zone and will take into account the UTC setting on the host. This isn’t bad behavior, just be aware of this so you don’t freak out when you check the time via the command line.
02-date-esxi-command-line
03-Webclient NTP
CMOS clock
ESXi synchronizes its system time with the hardware clock (CMOS/BIOS/ACPI)of the server if the NTP service is not running on the ESXi host. SuperMicro boards allow for NTP synchronization, but most home lab motherboards just provide the time as being configured in the BIOS. When the NTP daemon is started on the ESXi host it synchronizes its system time to the external time source AND it updates the hardware clock as well. I ran a test to verify this behavior. At the time of testing it was 12:37 (GMT+1 | UTC 10:37), NTP turned off and set the time in the BIOS to 6:37 UTC time. After booting the machine the command esxcli system time get confirmed ESX system time retrieved the time from the hardware clock. After starting the NTP Services, the system time was set to the correct time: 10:37.The command esxcli hardware clock get demonstrated that NTP also corrected the BIOS time. A quick BIOS check confirmed esxcli hardware clock get was displaying the BIOS configuration.
04-Insert esxcli screenshot
If your lab is not connected to the internet, confirm the BIOS time with the command esxcli hardware clock get and if necessary use the command esxcli hardware clock set -d (Day) -H (Hour) -m (Minute) -M (Month) -s (Second) -y (Year) to set the correct time.
Please note that ESXCLI reports time with the Z (Zulu) notation, this is the military name for UTC.
Raspberry Pi as a Stratum-1 NTP Server
When having a home lab, you usually face the age old dilemma common sense vs ‘exciting new stuff that you might not need but you would like to have’. You can update your CMOS clock manually or scripted, you can connect to an array of external NTP servers or you can build your own Stratum-1 NTP server using a Raspberry PI with a GPS add-on board .
Up next in this series:Home Lab fundamentals: Reverse DNS

Filed Under: Home Lab, VMware

ntpq -p connection refused error message

May 30, 2016 by frankdenneman

Sometimes a small misconfiguration can cause havoc in a complex distributed system. It becomes really annoying when no proper output is provided by log files and status report. While investigating time issues in my lab I ran into the following error message while executing the ntpq -p command:
01-ntpq-p connection refused
TL;DR
NTP client is disabled, enable it via the GUI
The standard NTP query program (ntpq) is one of the quickest way to verify that the Network Time Protocol Daemon (ntpd) is up and running. The command ntpq -p prints a list of peers known to the ESXi host as well as a summary of their state. Running the command on another ESXi host provided the following output.
02-ntpq -p feedback
Requesting the status of the NTPD status on the host with weird time issues, shows it’s not running. No proper feedback is provided by the command line other than it’s starting, no failure code is returned.
03.NTPD status
Management service initialisation, such as ntpd starts are logged in the file /var/log/syslog.log in ESXi 5.1 and up. Unfortunately, nothing useful is logged in this logfile as well.
04.syslog.log output
I couldn’t find a command that provides accurate output whether the NTP client was enabled or not. Time to open up the web client. Host time configuration can be found when selecting the ESXi host, Manage, Time Configuration. Apparently NTP was not enabled.
05-NTP client disabled
Simple problem to fix, unfortunately there is no simple command line function that allows to verify while NTP client is enabled (sans PowerCli)

Filed Under: VMware

No network connection after re-registering VCSA using the I've copied it answer

May 24, 2016 by frankdenneman

Paulo Coelho once stated “Life moves very fast. It rushes from Heaven to Hell in a matter of seconds” Well I think he perfectly described a day working in the lab and rushing through a migration. I’m upgrading the lab and I moved the vCenter Server Appliance (VCSA) to its new home. While trying to do a million things all at once, I didn’t pay attention to the question whether I moved the virtual machine or whether I copied it. I selected the option “I copied it”. And that’s when the fun started, vCenter down.
TL;DR:
Selecting “I copied it” implies that this machine is a duplicate and that a new identity should be generated. This means that the VM is getting a new UUID and a new MAC address. SUSE Linux Enterprise Server 11 detects this new MAC address and views this as a new Ethernet Device. The VCSA does not allow the creation of a new ethernet controller. Rename 70-persistent-net.rules file and reboot to have SUSE auto-generate a new 70-persistent-net.rules file with the correct MAC Address that allows you restore network connectivity via the console.
Troubleshooting the problem
Both the web client and the VCSA config web page are unreachable, time to open up the VM console (Alt-F1). When logging in and pinging the gateway the error, the system returns the error message “Network is unreachable”
01-VCSA network is unreachable
Before tinkering with the configuration files, I like to restart the services and see if the status report exposes interesting information.
02-VCSA service network restart
“No configuration found for eth1”. The VCSA is configured with a single NIC and SUSE Linux Enterprise Server 11, which is the OS for the appliance, assigns the label eth0 to the first Ethernet adapter. VCSA networking is configured through the Virtual Appliance Management Interface (VAMI). Executing the command “/opt/vmware/share/vami/vami_config_net allows you to retrieve the current network configuration
03-VCSA vami_config_net
When selecting option 6 “IP Address Allocation for eth1” VAMI reveals that it cannot read the interface files for ‘eth1’
04-VCSA-IP_address-Alloc_for_Eth1
The networking interface files are stored in the directory /etc/sysconfig/networking/devices. When listing the files (ls) only ifcfg-eth0 shows up. Reviewing the ifcfg-eth0 file with cat shows that the correct networking configuration is still applied to eth0.
05-VCSA-ifcfg-eth0 results
It looks like the problem occurs due to the way SUSE handles devices. The following text is copied directly from the SUSE documentation:

When the Kernel detects a network card and creates a corresponding network interface, it assigns the device a name depending on the order of device discovery, or order of the loading of the Kernel modules. The default Kernel device names are only predictable in very simple or tightly controlled hardware environments. Systems which allow adding or removing hardware during runtime or support automatic configuration of devices cannot expect stable network device names assigned by the Kernel across reboots.
However, all system configuration tools rely on persistent interface names. This problem is solved by udev. The udev persistent net generator (/lib/udev/rules.d/75-persistent-net-generator.rules) generates a rule matching the hardware (using its hardware address by default) and assigns a persistently unique interface for the hardware. The udev database of network interfaces is stored in the file/etc/udev/rules.d/70-persistent-net.rules. Every line in the file describes one network interface and specifies its persistent name

Source: https://www.suse.com/documentation/sled11/book_sle_admin/data/sec_basicnet_manconf.html
When the ESXi host assigns the VM a new MAC Address, SUSE assigns a new unique interface to this MAC address and stores this in the file etc/udev/rules.d/70-persistent-net.rules.
06-VCSA-70-persistent-net_rules
It shows two Ethernet adapters, eth1 is using the MAC address currently assigned to the VM.
07-VCSA-VM network-configuration
We are now entering a twilight zone, where there is one ethernet interface configured with an IP-address (ifcfg-eth0) while SUSE is applying all rules to a device it created and using the MAC Address assigned to the only NIC attached to the VM (Network Adapter 1). Time to clean up. Luckily udev rules are automatically generated during boot. To solve the mac address assignment fast, rename the file 70-persistent-net.rules
08-VCSA-rename udev file
After rebooting the VCSA, review the 70-persistent-net.rules file to verify that SUSE assigned the MAC address to eth0.
09-VCSA-clean udev rule
You can now safely customize the system (Press F2 in the console) and configure the management network
10-VCSA-configure management network
A reboot of the VCSA is necessary as it appears that a restart of the management services is not enough to restore all services. Funny how times change, nowadays you get really happy seeing a blue screen.
11-VCSA-weblogin

Filed Under: VMware

Monitoring power consumption of your home lab with a smart plug

May 19, 2016 by frankdenneman

Home labs are interesting beasts, at one hand you would love to have all the compute, storage and network power available, on the other hand you do not want to have a power bill similar to a Google data center.
I have a decent setup, with 4 Xeon servers, two cisco 1GB switches, a 10Gb switch and 3 Synology’s, but I don’t keep everything on all the time. One server acts as the management server, running a Windows DC, vCenter appliance, the PernixMS server and some other stuff. These machines are always on, not only to save time when I want to use my lab but increased stability as well. Due to this, my network gear and storage systems are also on. Which made me wonder how much the need for availability and stability will cost me on a yearly basis. The big Xeon rigs equipped with multiple PCIe devices are usually shut down after tests because I expect them to consume lots of power. Time to stop guessing and start monitoring. As always Home Lab Sensei Erik Bussink pointed me out to a simple solution the Smart Plug Edimax SP-2101W Smart Plug Switch. Please leave a comment if you are using a different solution that is a better alternative to this device.
The device
Nothing much to add about the device itself, it is sleek enough so it will not eat up multiple power outlets.
Edimax_SP2101W
The device is managed via an apple or android app, the following screenshots are taken from an Apple device, you can monitor it with both your iPhone or iPad. You can manage multiple smart plugs from one device. As I’ve spread my lab over two power-groups I’ve installed two power-plugs to monitor my home lab.
IMG_0469
Unfortunately, the app doesn’t allow displaying two smart plugs simultaneously, you have to open each individually. The monitor page shows the real time power consumption registered by the plug. It displays Amps and Watts. Quite cool to see what happens when you power-on devices or even a virtual machine, this monitored server generates a spike of 30 watts when powering on a VM, it quickly returns to a steady state though. Fun to see that ESXi hosts do not consume a steady high state of power.
IMG_0470
The Now button shows the real-time power consumption and the total power consumption registered of today, this week and this month. By providing the price of energy, it calculates the total cost additionally. Unfortunately I haven’t found the option to change the currency sign, so you are stuck with the dollar sign.
IMG_0471
By selecting the Usage button provides you a chart to view the power consumption of that day.
IMG_0472
The app allows you to analyze power consumption trends of your home lab by provides an overview based on 24 hours of data, a week, a month and a full year.
IMG_0473
Conclusion
The smart plugs are a great addition to my home lab, it provides me insights in the consumption and it for me personally have removed the reluctancy of leaving my full lab on. The answer to the question whether you need a smart plug if you run a home lab is in my opinion a straight and simple no. You can estimate cost or you can just ignore it and pay the bill when it arrives. I’m just curious about these things and it helps to clear my conscious.

Filed Under: Home Lab

Tracking down noisy neighbors

May 3, 2016 by frankdenneman

A big part of resource management is sizing of the virtual machines. Right-sizing the virtual machines allows IT teams to optimize the resource utilization of the virtual machines. Right sizing has become a tactical tool for enterprise IT-teams to ensure maximum workload performance and efficient use of the physical infrastructure. Another big part of resource management is keeping track of resource utilization, some of these processes are a part of the daily operation tasks performed by specialized monitoring teams or the administrators themselves. Service Providers usually cannot influence the right sizing element, therefor they focus more on the monitoring part. What is almost universal across virtual infrastructure owners is the incidental nature of tracking down ‘noisy-neighbors’ VMs . Noisy neighbor VMs generate workload in such a way that it monopolizes resources and have negative impact on the performance of other virtual machines. Service Providers and enterprise IT teams have to deal with these consumer outliers in order to meet the SLAs of existing workloads and being able to satisfy the SLA requirements of new workloads.
It’s interesting that noisy neighbor tracking is an incidental activity as it can be so detrimental to the performance of the virtual datacenter. Tools such as vSphere Storage IO Control (short term focus) and vSphere Storage DRS (long term focus) assist to alleviate the infrastructure from the burden of noisy neighbors, but attacking this problem structurally is necessary to ensure consistent and predictable performance from your infrastructure. At long term, noisy neighbor VMs impact the projected consolidation ratio, which in turn influences the growth rate of the infrastructure. I’ve seen plenty of knee jerk reactions, creating a server and storage infrastructure sprawl due to introduction of these outlier workloads.
Identifying noisy neighbors can become a valuable tool in both strategic and tactical playbooks of the IT organization. Having insight of which VMs are monopolizing the resources allow IT teams to act appropriately. Similar to real life the behavior of noisy neighbor can be changed often, but sometimes that’s the nature of the beast and you just have to live with it. In that situation noisy neighbors become outliers of conduct and one ha to make external adjustments. This insight allows IT teams to respond along the entire vertical axis of the virtual datacenter, from application to infrastructure choice. By having the correct analysis, the IT team can provide insights to the application owner, allowing them to adjust accordingly. It helps the IT team to understand whether the environment can handle the workload and make adjustment to the infrastructure necessary. Sometimes the intensity of the workload is just what it is and hosting that workload is necessary to support the business. In that case the IT team has to understand whether the infrastructure is suitable to support the application. As most IT organization have access to multiple platforms, the accurate insight of characteristics (and requirements) of the workload allows them to identify the correct platform.
Virtual Datacenters are difficult to monitor. They are comprised of a disparate stack of components. Every component logs and presents data differently. Different granularity of information, different time frames, and different output formats make it extremely difficult to correlate data. In addition you need to be able to correctly identify the workload characteristics and interpret the impact it has on the shared environment. We do not live in a world anymore where we have to deal with isolated technology stacks. Applications typically do not run anymore on a single box, connected to a single and isolated raid array. Today everything within the infrastructure is shared, the level of hardware resource distribution is diluting with each introduction of new hardware. Where we used to run a single application in a VM on top of server with ten other VMs, sharing a couple of NICs and HBA’s, we slowly moved towards converged network platforms. In the last 10 years, we shared and shared more, the only monolith remaining is the application in the VM and that is rapidly changing as well with the popularity of containers and micro services. Yet most of our testing mechanisms and monitoring efforts are still based on the architecture we left behind 10 years ago. Virtual Datacenters require continuous analytics that fully comprehends the context of the environment, with the ability to zoom in and focus on outliers if necessary.
Noisy Neighbor
In the upcoming series I’m going to focus on how to explore cluster level workloads and progressively zooming into specific workloads based on IOPS, block size, throughput and unaligned IOs.

Filed Under: Uncategorized

  • « Go to Previous Page
  • Page 1
  • Interim pages omitted …
  • Page 28
  • Page 29
  • Page 30
  • Page 31
  • Page 32
  • Interim pages omitted …
  • Page 89
  • Go to Next Page »

Copyright © 2026 · SquareOne Theme on Genesis Framework · WordPress · Log in