Welcome to part 6 of the Database workload characteristics series. Databases are considered to be one of the biggest I/O consumers in the virtual infrastructure. Database operations and database design are a study upon themselves, but I thought it might be interested to take a small peak underneath the surface of database design land. I turned to our resident Database expert Bala Narasimhan, PernixData’s VP of products to provide some insights about the database designs and their I/O preferences.
Previous instalments of the series:
Part 1 – Database Structures
Part 2 – Data pipelines
Part 3 – Ancillary structures for tuning databases
Part 4 – NoSQL platforms
Part 5 – Query Execution Plans
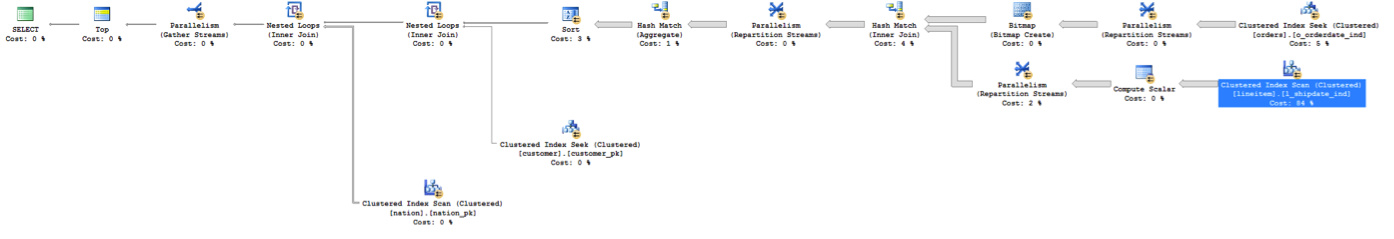
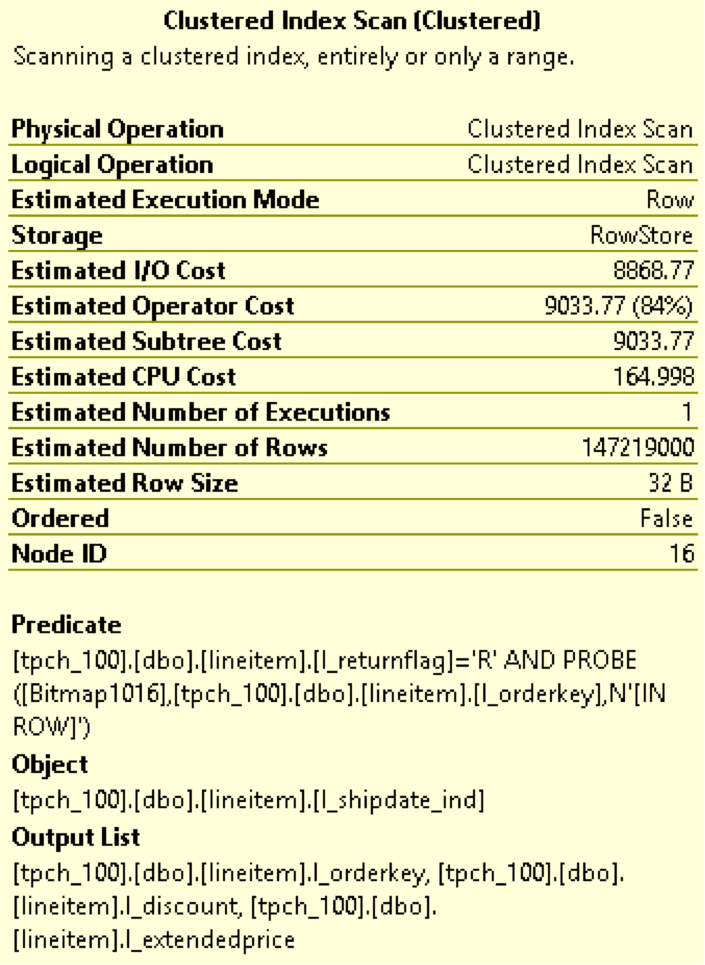
In a previous article I introduced the database query optimizer and described how it works. I then used a TPC-H like query and the SQL Server database to explain how to understand the storage requirements of a query via the query optimizer.
In today’s article we will deep dive into a specific aspect of query execution that severely impacts storage performance; namely intermediate results processing. For today’s discussion I will use the query optimizer within the PostgreSQL database. The reason I do this is because I want to show you that these problems are not database specific. Instead, they are storage performance problems that all databases run into. In the process I hope to make the point that these storage performance problems are best solved at the infrastructure level as opposed to doing proprietary infrastructure tweaks or rewrites within the database.
After a tour of the PostgreSQL optimizer we will go back to SQL Server and talk about a persistent problem regarding intermediate results processing in SQL Server; namely tempdb. We’ll discuss how users have tried to overcome tempdb performance problems to date and introduce a better way.
What are intermediate results?
Databases perform many different operations such as sorts, aggregations and joins. To the extent possible a database will perform these operations in RAM. Many times the data sets are large enough and the amount of RAM available is limited enough that these operations won’t fully fit in RAM. When this happens these operations will be forced to spill to disk. The data sets that are written to and subsequently read from disk as part of executing operations such as sorts, joins and aggregations are called intermediate results.
In today’s article we will use sorting as an example to drive home the point that storage performance is a key requirement for managing intermediate results processing.
The use case
For today’s example we will use a table called BANK that has two columns ACCTNUM and BALANCE. This table tracks the account numbers in a bank and the balance within each account. The table is created as shown below:
Create Table BANK (AcctNum int, Balance int);
The query we are going to analyze is one that computes the number of accounts that have a given balance and then provides this information in ascending order by balance. This query is written in SQL as follows:
Select count(AcctNum), Balance from BANK GROUP BY Balance ORDER BY Balance;
The ORDER BY clause is what will force a sort operation in this query. Specifically we will be sorting on the Balance column. I used the PostgreSQL database to run this query.
I loaded approximately 230 million rows into the BANK table. I made sure that the cardinality of the Balance column is very high. Below I have a screenshot from the PostgreSQL optimizer for this query. Note that the query will do a disk based merge sort and will consume approximately 4 GB of disk space to do this sort. A good chunk of the query execution time was spent in the sort operation.

A disk-based sort, and other database operations that generate intermediate results, is characterized by large writes of intermediate results followed by reads of those results for further processing. IOPS is therefore a key requirement.
What is especially excruciating about the sort operation is that it is a materialization point. What this means is that the query cannot make progress until the sort is finished. You’ve essentially bottlenecked the entire query on the sort and the intermediate results it is processing. There is no better validation of the fact that storage performance is a huge impediment for good query times.
What is tempdb?
tempdb is a system database within SQL Server that is used for a number of reasons including the processing of intermediate results. This means that if we run the query above against SQL Server the sorting operation will spill intermediate results into tempdb as part of processing.
It is no surprise then that tempdb performance is a serious consideration in SQL Server environments. You can read more about tempdb here.
How do users manage storage performance for intermediate results including tempdb?
Over the last couple of years I’ve talked to a number of SQL Server users about tempdb performance. This is a sore point as far as SQL Server performance goes. One thing I’ve seen customers do to remediate the tempdb performance problem is to host tempdb alone in arrays that have fast media, such as flash, in them in the form of either hybrid arrays or All Flash Arrays (AFA). The thought process is that while the ‘fast array’ is too expensive to standardize on, it makes sense to carve out tempdb alone from it. In this manner, customers look at the ‘fast array’ as a performance band aid for tempdb issues.
On the surface this makes sense since an AFA or a hybrid array can provide a performance boost for tempdb. Yet it comes with several challenges. Here are a few:
- You now have to manage tempdb separately from all the other datastores for your SQL Server.
- You procure the array for tempdb yet you do not leverage any of its data services. You use it as a performance band aid alone. This makes the purchase a lot more expensive than it seems on paper.
- For queries that don’t leverage tempdb the array is not useful.
- Performance problems in databases are not limited to tempdb. For example, you may be doing full table scans and these don’t benefit from the array.
- You cannot leverage innovations in media. You cannot, for example, leverage RAM or PCM or anything else that will come in the future for tempdb.
How can PernixData FVP help?
In my mind PernixData FVP is the ideal solution for storage performance problems related to intermediate results in general and tempdb in particular. Intermediate result processing, including tempdb, shows very good temporal locality and is therefore an ideal candidate for FVP. Below are some other reasons why FVP is ideal for this scenario:
- PernixData FVP allows you to use all server side media, flash or RAM, for accelerating tempdb and intermediate results processing.
- You don’t need to configure anything separately for this. Instead you operate at the VM level and accelerate your database VM as a result of which every I/O operation is enhanced including intermediate results processing.
- As your tempdb requirements change – lets say you need for space for handling it – it’s simply a matter of replacing one flash card with bigger one as far as FVP is concerned. There is no down time and the application is not impacted. This allows you to ride the price/performance curve of flash seamlessly.